
Median Graph Demonstration
Loading the math board and drawing, please wait…
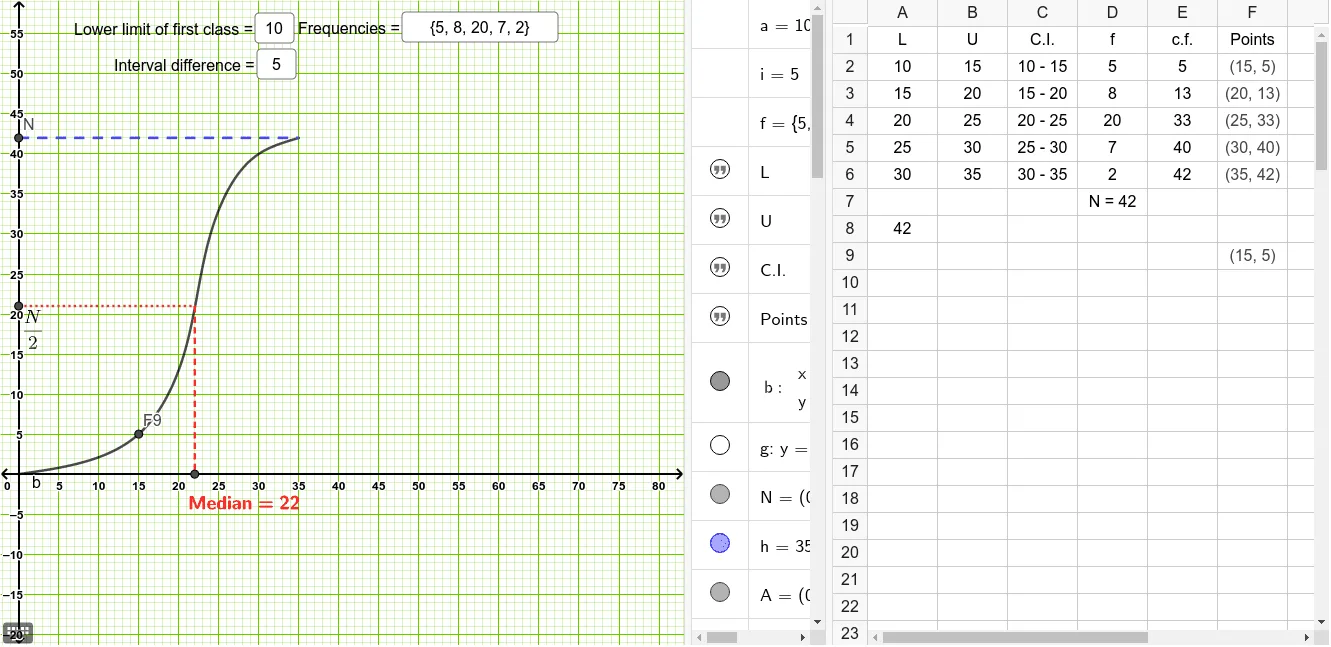
This example demonstrates the calculation and representation of the median through interactive graphing, involving core math concepts like median in statistics, function graphs, equation solving, and correlation analysis. It uses commands/objects such as Textfield, Element, Spline, Line, Intersect, Segment, TableText, Sum, If in GeoGebra for construction, suitable for high school and above learners/teachers in statistics and function graphing education.
GeoGebra Commands & Parameters
Textfield(a) → InputBox1Textfield(i) → InputBox2Textfield(f) → InputBox3Element(f, 1) → D2Element(f, 2) → D3Element(f, 3) → D4Element(f, 4) → D5Element(f, 5) → D6Spline({(0, 0), F2, F3, F4, F5, F6}, 3) → bLine(F6, xAxis) → gIntersect(g, yAxis) → NSegment(N, F6) → hTableText({{C1, C2, C3, C4, C5, C6}, {D1, D2, D3, D4, D5, D6}}, "|_cccccc") → text3TableText({{C1, D1, E1}, {C2, D2, E2}, {C3, D3, E3}, {C4, D4, E4}, {C5, D5, E5}, {C6, D6, E6}, {C7, D7, E7}}, "|_ccc") → text5Sum(D2:D6) → A8If(E2 < c ≤ E3, A3, If[E3 < c ≤ E4, A4, If[E4 < c ≤ E5, A5, If[E5 < c ≤ E6, A6, 0]]]) → LIf(E2 < c ≤ E3, C3, If[E3 < c ≤ E4, C4, If[E4 < c ≤ E5, C5, If[E5 < c ≤ E6, C6, C1]]]) → ClassIf(E2 < c ≤ E3, E2, If[E3 < c ≤ E4, E3, If[E4 < c ≤ E5, E4, If[E5 < c ≤ E6, E5, 0]]]) → cfIf(E2 < c ≤ E3, D3, If[E3 < c ≤ E4, D4, If[E4 < c ≤ E5, D5, If[E5 < c ≤ E6, D6, 0]]]) → freLine(B, yAxis) → jIntersect(j, b) → CIntersect(j, b) → DLine(B, yAxis) → kLine(A, xAxis) → lIntersect(j, k) → EIntersect(l, j) → FSegment(A, F) → mSegment(F, B) → n
AI Drawing Prompt Reference
Draw a function graph by entering a function expression, calculate and display the median, draw the median line, and find its intersections with the x-axis and y-axis, as well as the intersections with the function graph. First, enter the function expression, then draw the function graph based on the expression, calculate the function values, and determine the median. Draw the median line and find its intersection with the y-axis, locate the intersection points with the function graph, and finally connect these points to form the median line segments.
The prompt above was compiled from the original drawing commands and is for reference only.