
Measures of Central Tendency
Loading the math board and drawing, please wait…
In collections
Numeracy Practice
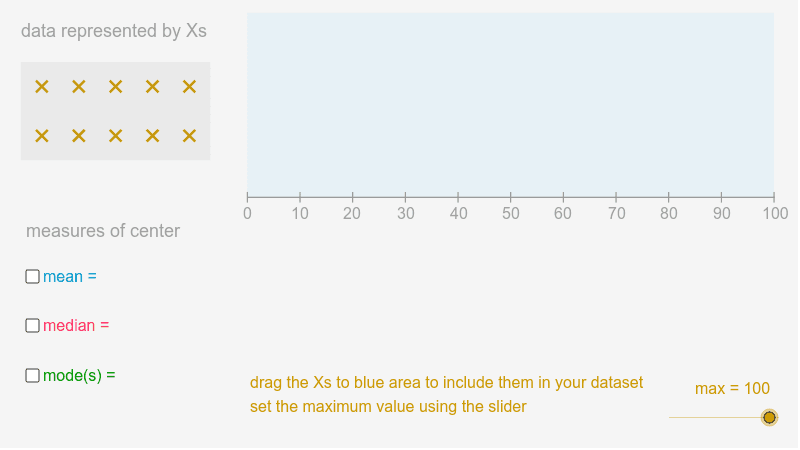
This example demonstrates how to construct and visualize measures of central tendency such as mean, median, and mode using GeoGebra. It involves core mathematical concepts like statistical characteristics, vectors, sequences, and polygons. The construction utilizes commands like RemoveUndefined, Mode, Element, Median, Mean, Vector, Sequence, Segment, Append, and Polygon. Suitable for high school mathematics education to understand and apply central tendency concepts in probability and statistics.
GeoGebra Commands & Parameters
RemoveUndefined(list6) → list10Mode({x(A) * Maximum / 10, x(B) * Maximum / 10, x(C) * Maximum / 10, x(D) * Maximum / 10, x(E) * Maximum / 10, x(F) * Maximum / 10, x(T) * Maximum / 10, x(Q) * Maximum / 10, x(S) * Maximum / 10, x(U) * Maximum / 10}) → list1Element(list1, 1) → cMedian(list10) → bMean(list10) → aElement(list11, 2) → mo_2Element(list11, 3) → mo_3Element(list11, 4) → mo_4Element(list11, 5) → mo_5Element(list11, 1) → mo_1Vector(L, K) → fSequence((i, 0), i, 0, 10) → list2Segment(AA, BB) → mAppend(list6, list7) → list8RemoveUndefined(list8) → list9Mean(list6) → aaPolygon((0, 0), (10, 0), (10, 3.75), (0, 3.75)) → bin, h, i, j, lSequence(Segment[(i, -1 * 0.1), (i, 0.1)], i, 0, 10) → list3Vector(N, M) → gVector(P, O) → kVector(J, I) → eVector(G, H) → dPolygon(V, W, A_1, B_1) → poly1, v, w, a_1, b_1Vector(NN, MM) → pVector(RR, OO) → q