
Measurement Stations
Loading the math board and drawing, please wait…
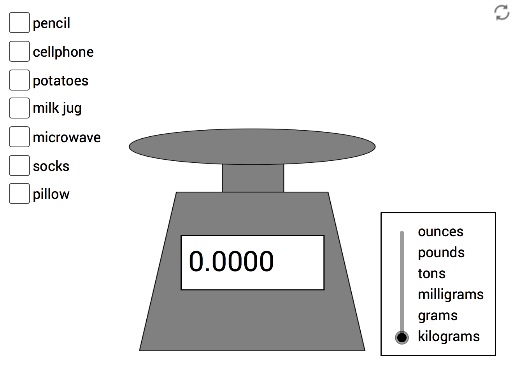
This example demonstrates data collection and statistical analysis through multiple measurement stations. It involves core math concepts like arithmetic operations, random experiments, boxplots, logarithmic functions, diagrams, and hypothesis testing. GeoGebra commands and objects used include If, Sum, Polygon, and various points (A, B, C, D, E, F, G, H, I, J, K, L, M, N). Suitable for high school and above, focusing on data analysis and statistics applications.
GeoGebra Commands & Parameters
If(a, A1, 0) → B1If(b, A2, 0) → B2If(e, A5, 0) → B5If(f, A6, 0) → B6If(g, A7, 0) → B7If(c, A3, 0) → B3If(d, A4, 0) → B4Sum(B1:B7) → B8Polygon(T, U, V, W) → poly1, t, u, v, wPolygon(Z, A_1, B_1, C_1) → poly2, z_1, a_1, b_1, c_1
AI Drawing Prompt Reference
Create a statistical analysis diagram with multiple measurement stations showing data collection and random experiments. Use conditional statements to generate points based on variable values, calculate the total sum, and form shapes by connecting points with polygons to demonstrate coordinate geometry and geometric construction, suitable for high school level data analysis education.
The prompt above was compiled from the original drawing commands and is for reference only.