
Means Relationship Demonstration
Loading the math board and drawing, please wait…
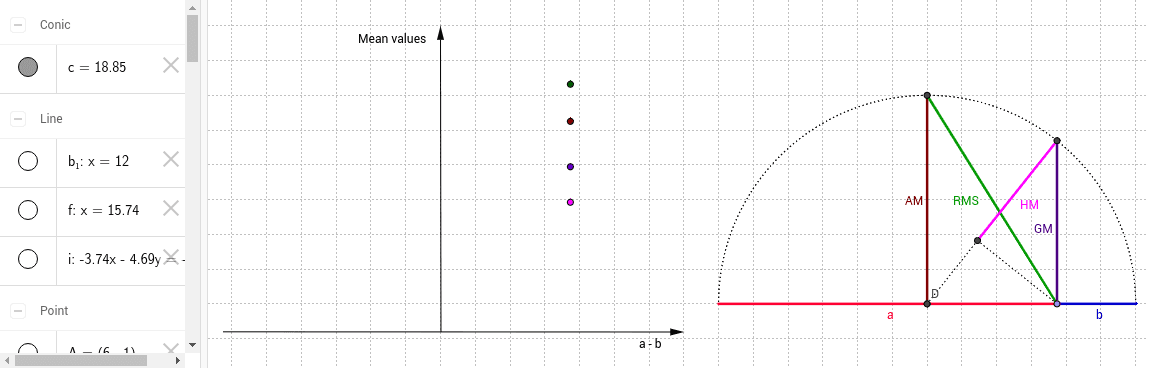
This example demonstrates how different means (root mean square, arithmetic mean, geometric mean, etc.) vary as the relationship between two values, a and b, changes. It involves core mathematical concepts such as mean types, inequality relationships, and geometric constructions. The construction uses GeoGebra commands like Semicircle, Segment, Point, Midpoint, OrthogonalLine, Intersect, Vector, and Translate. It is suitable for high school and above students to understand mean theorems and geometric intuition.
GeoGebra Commands & Parameters
Semicircle(A, B) → cSegment(A, B) → a_1Point(a_1) → CMidpoint(A, B) → DOrthogonalLine(D, a_1) → b_1Intersect(c, b_1, 1) → ESegment(E, D) → AMSegment(E, C) → RMSOrthogonalLine(C, a_1) → fIntersect(c, f, 1) → FSegment(F, C) → GMSegment(D, F) → hOrthogonalLine(C, h) → iIntersect(i, h) → GSegment(G, C) → jSegment(G, F) → HMSegment(G, D) → lSegment(A, C) → aSegment(C, B) → bPoint(f) → PVector(Q, R) → vTranslate(P, v) → P'Vector(P, P') → uPoint(Circle[P', RMS]) → HSegment(P', H) → dPoint(Circle[P', AM]) → ISegment(P', I) → ePoint(Circle[P', GM]) → JSegment(P', J) → gPoint(Circle[P', HM]) → KSegment(P', K) → kVector(L, M) → wPoint(w) → NVector(N, O) → z
AI Drawing Prompt Reference
Draw a geometric diagram showing the relationships between different means: start with a line segment and its semicircle, find the midpoint and perpendicular line to create key intersection points. Connect these points to form segments representing root mean square, arithmetic mean, geometric mean, and harmonic mean. Add auxiliary lines and points via vector translation and circle intersections to illustrate the geometric intuition of mean theorems.
The prompt above was compiled from the original drawing commands and is for reference only.