
Meaning of a Point in a Scatter Plot
Loading the math board and drawing, please wait…
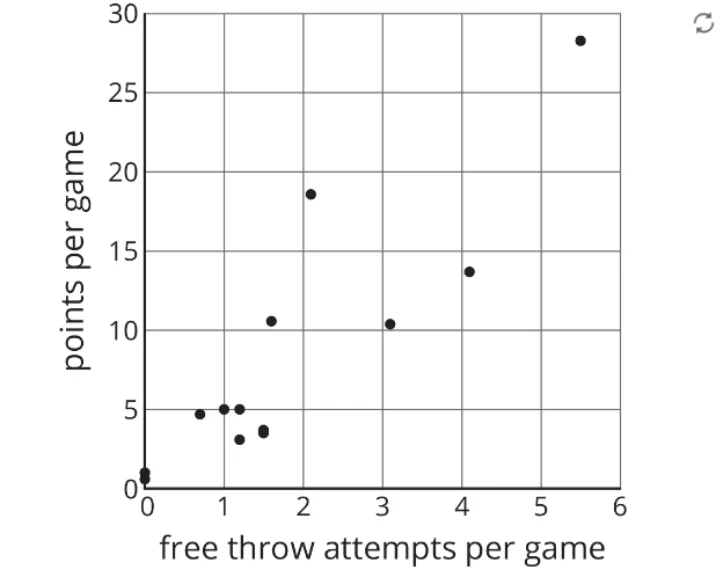
This example demonstrates how the position of a point in a scatter plot reflects data relationships. Key math concepts include data analysis, statistical patterns, and coordinate geometry. Constructed using GeoGebra objects A, B, and pic1 to create scatter plots and annotations. Suitable for middle school and above students for understanding data visualization and statistical applications.
GeoGebra Commands & Parameters
Point A(-13.65821732885539, -2.3134630468648893)Point B(-0.49962375812893844, -2.3134630468648893)
AI Drawing Prompt Reference
Draw a scatter plot with two points. The first point is at (-13.65821732885539, -2.3134630468648893) and the second at (-0.49962375812893844, -2.3134630468648893). Both points are on the same horizontal line to show data relationships.
The prompt above was compiled from the original drawing commands and is for reference only.