
Mean Value Theorem by Rasha Tarek
Loading the math board and drawing, please wait…
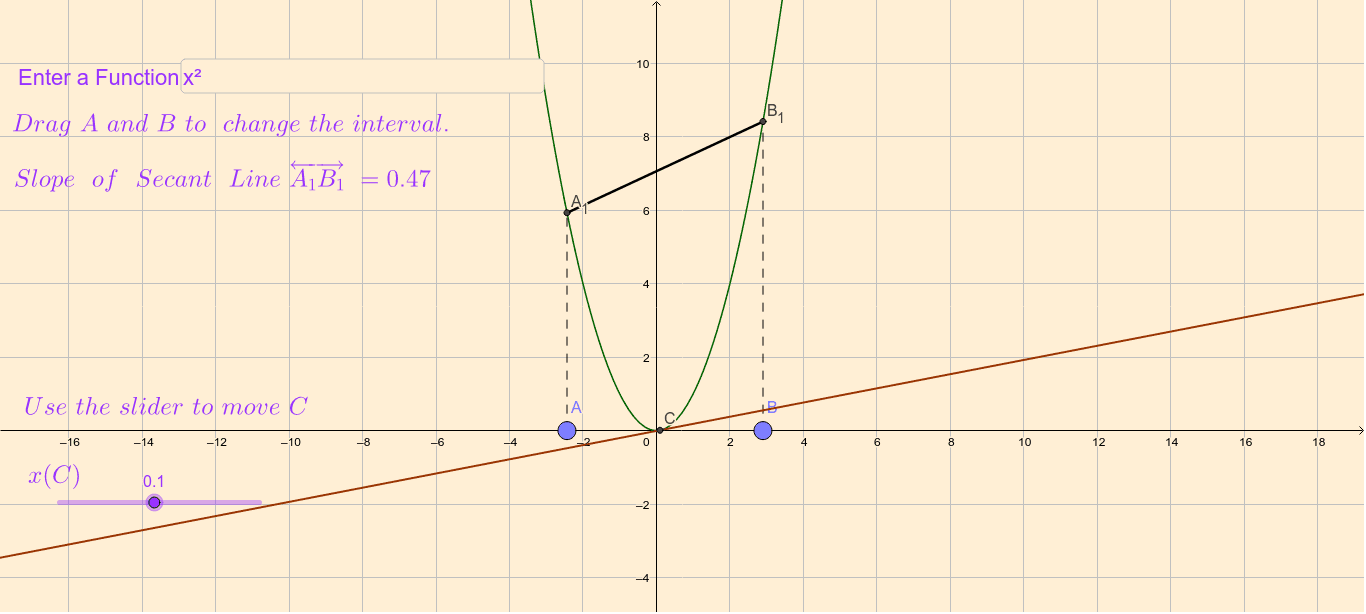
This example illustrates the Mean Value Theorem, which states that for a continuous function on a closed interval, there exists at least one point where the derivative equals the average rate of change over the interval. Using commands like Point, Ray, Textfield, Segment, Line, Slope, Tangent, and FractionText, it visually demonstrates the core idea of the theorem. Suitable for high school mathematics education and learning.
GeoGebra Commands & Parameters
Point(b) → FRay(D, F) → lPoint(b) → ERay(D, E) → kPoint(k) → APoint(l) → BTextfield(f) → InputBox1Segment(A_1, B_1) → aLine(A_1, B_1) → cSlope(c) → dSegment(A, A_1) → eSegment(B, B_1) → gTangent(C, f) → iSlope(i) → jFractionText(d) → text5FractionText(j) → text6
AI Drawing Prompt Reference
Draw a continuous function on a closed interval, mark the endpoints, connect them with rays, take a point on one ray, draw line segments and a line through the point and endpoints, calculate the slope of the line as the average rate of change, then draw a tangent at the point on the function and calculate its slope as the instantaneous rate of change, finally display both slopes in text boxes to visually illustrate the Mean Value Theorem.
The prompt above was compiled from the original drawing commands and is for reference only.