
Mean from Groups
Loading the math board and drawing, please wait…
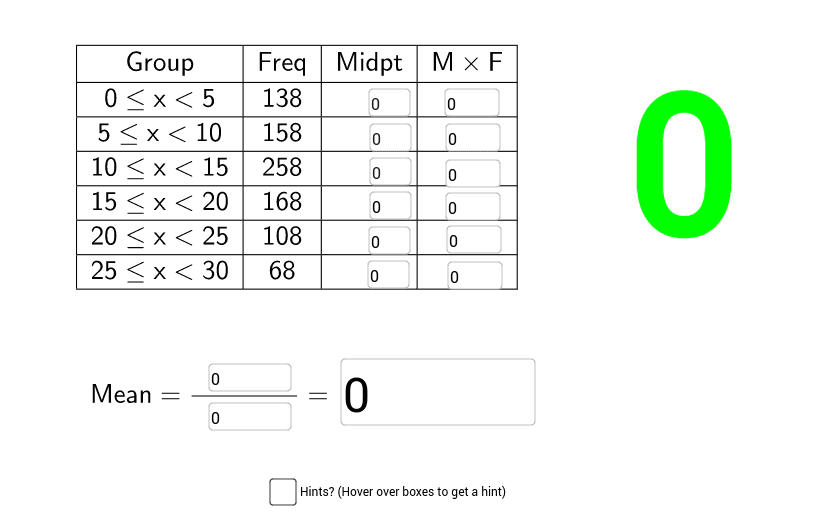
This example demonstrates how to calculate the overall mean from grouped data. It involves core math concepts like mean, histogram, piecewise functions, percentages, and variance. Construction highlights include using GeoGebra commands such as Sequence, Insert, TableText, Textfield, Sum, etc., for data grouping and mean calculation. Suitable for high school mathematics teaching, particularly for probability & statistics and data analysis beginners.
GeoGebra Commands & Parameters
Sequence(Random[5, 25], i, 1, 6) → freq6Sequence({((n * i)) / 6 + "≤x<" + (((n * (i + 1))) / 6), freq6(i + 1), " ", " "}, i, 0, 5, 1) → list1Insert({{"Group", "Freq", "Midpt", "M \times F"}}, list1, 1) → list2TableText(list2, "c|_") → text1Textfield(M_2) → InputBox2Textfield(M_7) → InputBox1Textfield(M_3) → InputBox3Textfield(M_4) → InputBox4Textfield(M_5) → InputBox5Textfield(M_6) → InputBox6Textfield(MF_1) → InputBox7Textfield(MF_2) → InputBox8Textfield(MF_3) → InputBox9Textfield(MF_4) → InputBox10Textfield(MF_5) → InputBox11Textfield(MF_6) → InputBox12Textfield(SMF) → InputBox11_1Textfield(SF) → InputBox12_1Textfield(MN) → InputBox13Sum(Sequence[(((((2 * i) - 1) * n)) / 12 * freq6(i)), i, 1, 6]) → SMF_{right}Text(score) → TSc
AI Drawing Prompt Reference
Create a visualization showing how to calculate the overall mean from grouped data. Generate six random frequency data points, then create a table listing the groups, frequencies, midpoints, and products. Plot a histogram based on the frequency data, calculate the sum of products for each group, and display the computed overall mean.
The prompt above was compiled from the original drawing commands and is for reference only.