
Mean and Standard Deviation by Mikko Rahikka
Loading the math board and drawing, please wait…
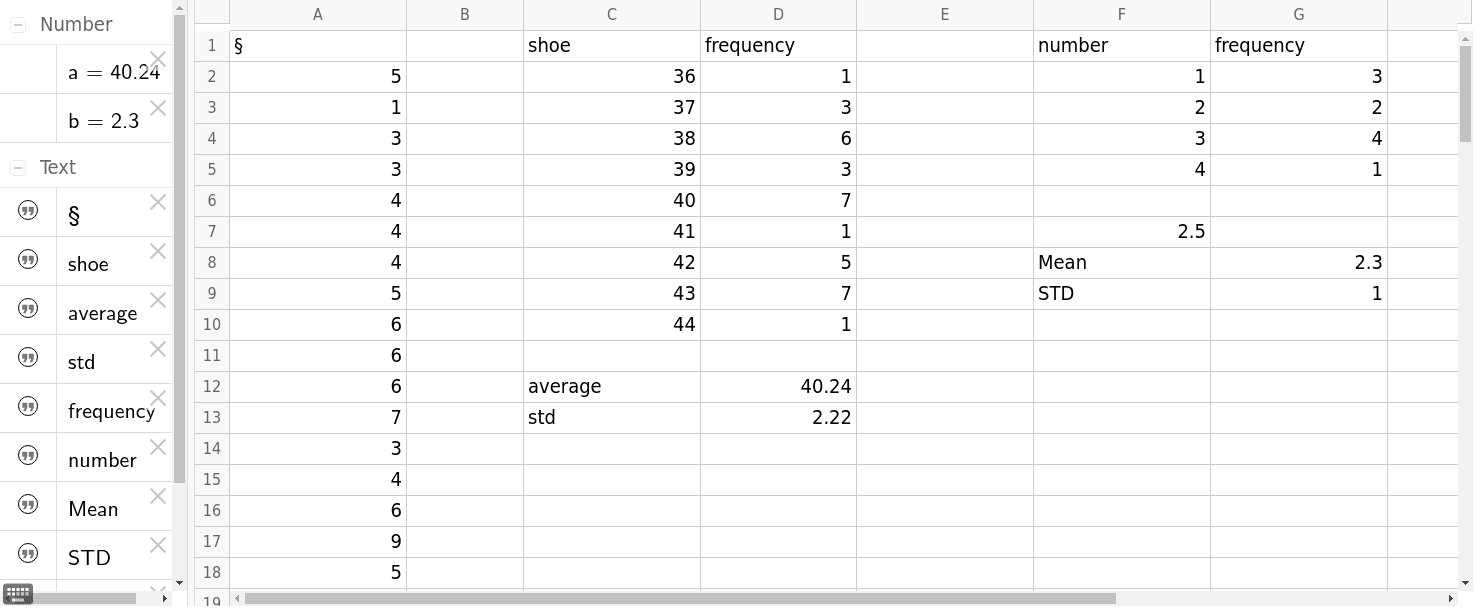
This example demonstrates how to calculate the mean and standard deviation of a set of data. Key mathematical concepts include the methods for calculating mean and standard deviation. Using GeoGebra commands like Mean and SD, it visually illustrates the central tendency and dispersion of data. Suitable for high school mathematics education and learning.
GeoGebra Commands & Parameters
Mean(C2:C10, D2:D10) → aMean(C2:C10, D2:D10) → D12SD(C2:C10, D2:D10) → D13Mean(F2:F5) → F7Mean(F2:F5, G2:G5) → bMean(F2:F5, G2:G5) → G8SD(F2:F5, G2:G5) → G9
AI Drawing Prompt Reference
Draw the mean and standard deviation of a set of data, including the mean and standard deviation of two sets of data C2:C10 and D2:D10, as well as the mean and standard deviation of another two sets of data F2:F5 and G2:G5. First, draw the mean of C2:C10 and D2:D10, then draw their standard deviations; next, draw the mean of F2:F5, and finally, draw the mean and standard deviation of F2:F5 and G2:G5.
The prompt above was compiled from the original drawing commands and is for reference only.