
Mean Absolute Deviation Demo
Loading the math board and drawing, please wait…
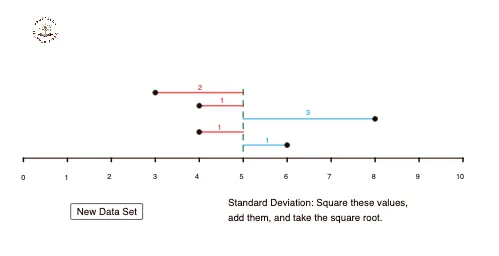
This example demonstrates how to use GeoGebra to construct a dataset and calculate the mean absolute deviation. Core math concepts include standard deviation, statistics, arithmetic, polygons, pie charts, and coordinates. Construction highlights involve commands like Segment, Sequence, If, and objects such as a, b, c, d, e, button1, sum, mean, f, L_1, text1, etc. Suitable for high school mathematics teaching to understand data dispersion and statistical calculations.
GeoGebra Commands & Parameters
Segment((0, 0), (10, 0)) → fSequence(Segment[(f, 0), (f, -0.25)], f, 0, 10, 1) → L_1, {0.25, 0.25, 0.25, 0.25, 0.25, 0.25, 0.25, 0.25, 0.25, 0.25, 0.25}Segment((mean, 0.5), (mean, 5.5)) → gIf(a < mean, Segment[(a, 1), (mean, 1)]) → hIf(a > mean, Segment[(a, 1), (mean, 1)]) → iIf(b < mean, Segment[(b, 2), (mean, 2)]) → jIf(b > mean, Segment[(b, 2), (mean, 2)]) → kIf(c < mean, Segment[(c, 3), (mean, 3)]) → lIf(c > mean, Segment[(c, 3), (mean, 3)]) → mIf(d < mean, Segment[(d, 4), (mean, 4)]) → nIf(d > mean, Segment[(d, 4), (mean, 4)]) → pIf(e < mean, Segment[(e, 5), (mean, 5)]) → qIf(e > mean, Segment[(e, 5), (mean, 5)]) → r
AI Drawing Prompt Reference
Draw a horizontal axis with 10 equally spaced points from 0 to 10, each extending 0.25 units upward. Mark the mean value and draw 10 vertical line segments from the mean to each point, showing the distance to the mean. Use different colored segments to represent the deviation of each point from the mean based on its relative size.
The prompt above was compiled from the original drawing commands and is for reference only.