
Matrix Transformations: Sine Curves and Triangle Orthocenter in Action
Loading the math board and drawing, please wait…
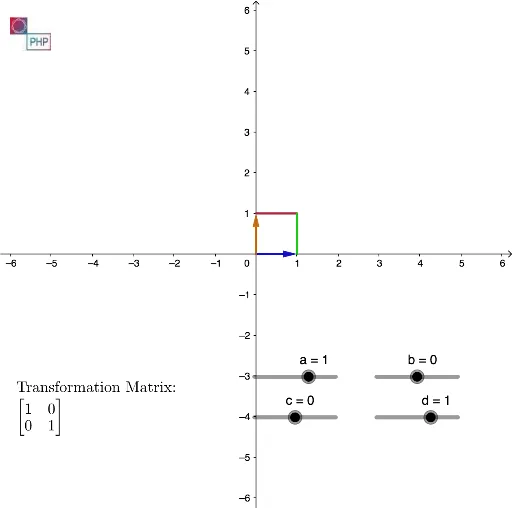
①This GeoGebra example dynamically demonstrates how matrix transformations alter geometric figures such as triangles, vectors, and sine curves, making the effects of linear maps visually intuitive. ②Core mathematical concepts include matrix multiplication, linear transformations, vector operations, sine functions, isosceles triangles, orthocenters, intersections, and percentages. ③Construction highlights: Vector and Segment commands create base vectors u, v and segments f, g; matrix M_1 transforms point A to produce u_1, then points B, C, D are derived; a sine curve i is plotted, with perpendicular line h and intersection points E, F; text1 and pic1 add annotations and images. ④Suitable for high school to early college students, this serves as an interactive tool for understanding the geometric meaning of matrix transformations, ideal for linear algebra or analytic geometry courses.
GeoGebra Commands & Parameters
Vector((0, 0), (1, 0)) → uVector((0, 0), (0, 1)) → vSegment((1, 0), (1, 1)) → fSegment((0, 1), (1, 1)) → gVector((0, 0), A) → u_1Vector((0, 0), B) → v_1Segment(B, D) → iSegment(A, D) → h
AI Drawing Prompt Reference
Draw a coordinate plane with two unit vectors from the origin, one horizontal and one vertical, connected by segments to form a unit square. Place a point in the plane, draw a vector from the origin to it, then apply a linear transformation to get a new point and draw the transformed vector. Next, plot a sine curve and a line perpendicular to it, marking their intersection. Finally, include a triangle with its orthocenter labeled, and add text and images to annotate key features, illustrating how matrix transformations affect shapes.
The prompt above was compiled from the original drawing commands and is for reference only.