
Mapping Diagrams: Functions with Complex Parameters - Circles
Loading the math board and drawing, please wait…
In collections
Mapping Diagrams to Visualize Complex Analysis
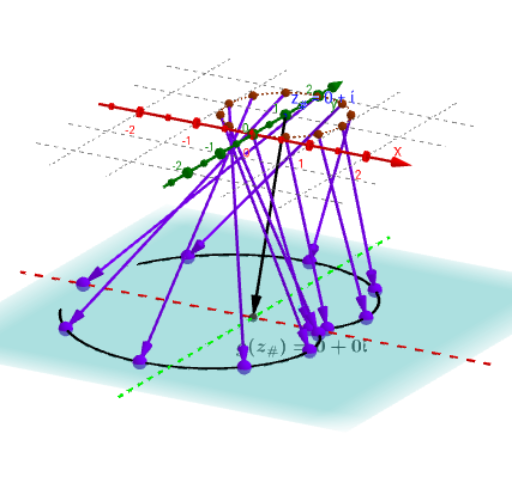
This example demonstrates mapping diagrams for functions with complex parameters, particularly focusing on circles. It involves core concepts in complex analysis such as mapping, parameter transformations, and loci. Using GeoGebra commands like Sequence, Circle, Point, etc., users can dynamically explore the impact of complex parameters on function graphs. Suitable for high school and above students or teachers for teaching and learning the geometric properties of complex functions.
GeoGebra Commands & Parameters
Sequence(0, m) → MZip(((2 * π) * k / m), k, M) → t_*Zip((δ * ℯ^((t * ί))) + z_#, t, t_*) → z_*Circle(z_#, δ) → circPoint(circ) → AZip(h(z), z, z_*) → hz_*Zip((x(z), y(z), ht), z, hz_*) → hpt_*Line(O, ZY1) → YaxLine(O, ZX1) → XaxZip(Vector[A, B], A, z_*, B, hpt_*) → hvec1_*Vector(z_#, Gz1_#) → vecg_#Vector(z_#, Hz1_#) → vech_#Locus(PtAG, A) → gLocLocus(PtAH, A) → hLocTextfield(G) → InputBox1Textfield(H) → InputBox2Zip(g(z), z, z_*) → gz_*Zip((x(z), y(z), ht), z, gz_*) → gpt_*Zip(Vector[A, B], A, z_*, B, gpt_*) → gvec1_*Point(xAxis) → x_#Locus(gx_#, x_#) → grealLocus(hx_#, x_#) → hreal