
Mapping Diagrams for Arithmetic Operations
Loading the math board and drawing, please wait…
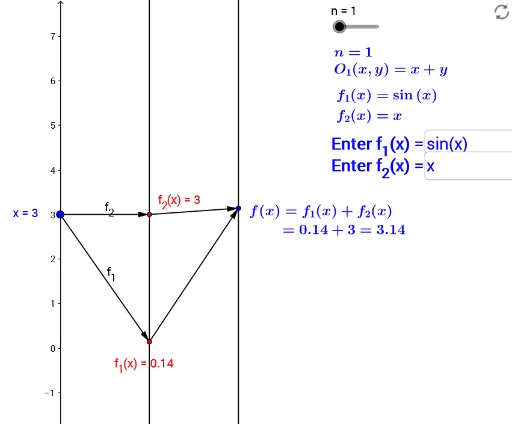
This example demonstrates the input-output relationships of arithmetic operations (addition, subtraction, multiplication, division) using mapping diagrams. It involves core mathematical concepts such as mapping, functions, sets, and operational logic. The construction utilizes GeoGebra commands like Point, Element, Vector, and Textfield to create objects like functions f_1, f_2, variables a, b, n, ops, s, D, A, B, O_n, C, u, v, and text fields, enabling dynamic and interactive visualizations. Suitable for high school mathematics education to help students grasp abstract function and operational relationships, enhancing visual thinking skills.
GeoGebra Commands & Parameters
Point(yAxis) → DElement(ops, n) → O_nVector(A, C) → uVector(B, C) → vVector(D, A) → wVector(D, B) → dTextfield(f_1) → InputBox1Textfield(f_2) → InputBox2