
Mapping Diagrams and Graphs of Functions by staffas broussard
Loading the math board and drawing, please wait…
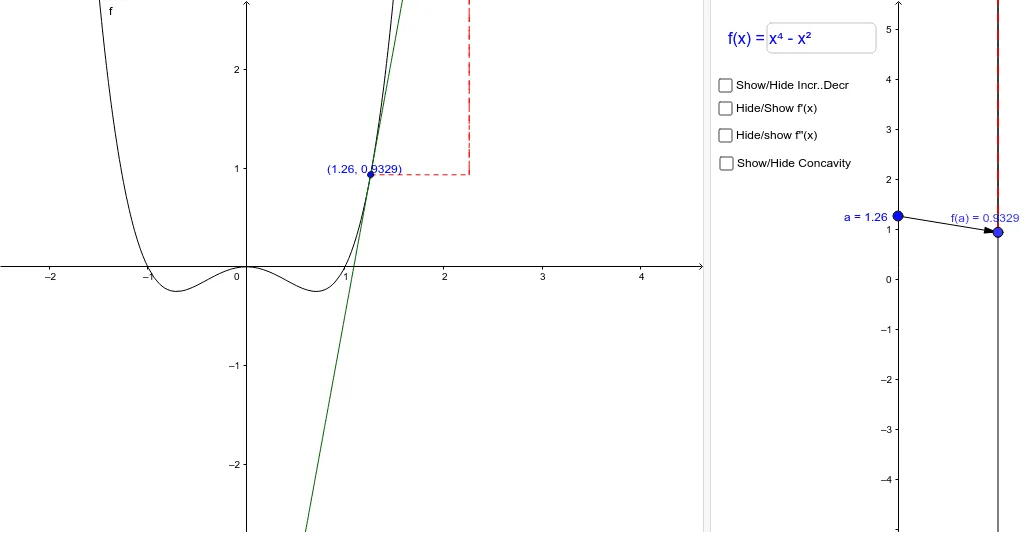
This example demonstrates the correspondence between mapping diagrams and function graphs, highlighting geometric properties and transformations. Core math concepts include functions, derivatives, trigonometric functions, complex numbers, similar triangles, and geometric transformations. Constructed using GeoGebra commands like Point, Derivative, Textfield, Vector, Segment, Line, Intersect, and Sequence. Ideal for high school and above students to visualize function behavior and transformations.
GeoGebra Commands & Parameters
Point(yAxis) → ADerivative(f) → f'Textfield(tanL) → inputBox1Vector(x_1, y_1) → vSegment(f_x, F) → cSegment(E, F) → dSegment(A, x_1) → eSegment(B, y_1) → gSegment(B, y_1) → dyLine(x_1, y_1) → iLine(A, B) → kIntersect(i, k) → FocusVector(A, B) → uVector(x_1, C) → wTextfield(f) → inputBox2Vector(B, y_1) → bVector(F, E) → hSequence((0, x(Point[Element[CRITPT, k]])), k, 1, 5) → MDCPSequence((0, x(Point[Element[CRITPT2, k]])), k, 1, 4) → MDCP2
AI Drawing Prompt Reference
Draw a mapping diagram and function graph to show the correspondence between them. Include an x-axis and a function graph, marking the origin and derivative. Add an input box for the function and use vectors to represent geometric properties and transformations. Draw line segments and triangles, labeling key points and intersections to highlight similar triangles and geometric transformations. Use sequence points to show mapping relationships and vectors for directions and transformations.
The prompt above was compiled from the original drawing commands and is for reference only.