
Mapping Diagrams and Graphs of Functions by staffas broussard (2)
Loading the math board and drawing, please wait…
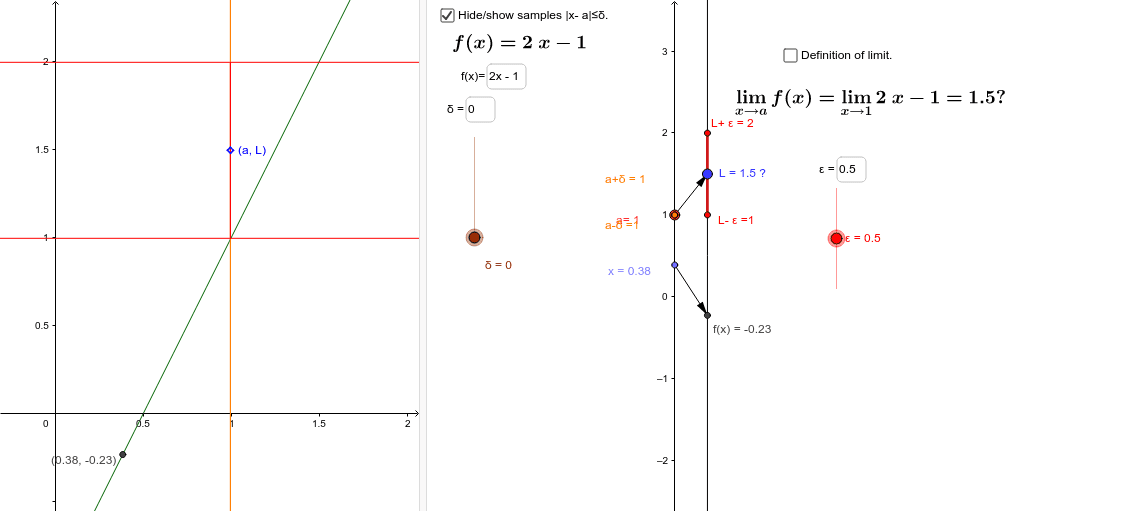
This example demonstrates the construction of mapping diagrams and function graphs. Key mathematical concepts include function definition, mapping relationships, and graph plotting. Construction involves GeoGebra commands such as Point, Vector, Segment, Line, etc. Suitable for middle school or high school students learning function graphs and mapping concepts, useful as a teaching aid.
GeoGebra Commands & Parameters
Point(yAxis) → APoint(Target) → LIMVector(A, LIM) → fTextfield(f_1) → inputBox1Vector(x_1, y_1) → vSegment(f_a, F) → cSegment(E, F) → dSegment(A, x_1) → eSegment(LIM, y_1) → gSegment(LIM, y_1) → hLine(x_1, y_1) → iTextfield(f_1) → inputBox2Derivative(f_1) → qSegment(C, D) → bSegment((0, y(A) - δ), (0, y(A) + δ)) → mPoint(yAxis) → IVector(I, J) → uIntersect(n, p) → KIntersect(a, p) → LIntersect(a, r) → MIntersect(n, r) → NPolygon(K, L, M, N) → poly1, k_1, l_1, m_1, n_1Sequence((0, xk), xk, y(A) - δ, y(A) + δ, δ / 8) → testxSequence((2, f_1(xk)), xk, y(A) - δ, y(A) + δ, δ / 8) → testySequence(Vector[(0, xk), (2, f_1(xk))], xk, y(A) - δ, y(A) + δ, δ / 8) → list1Textfield(ε) → inputBox3Textfield(δ) → inputBox4
AI Drawing Prompt Reference
Draw a mapping diagram and function graph to show the relationship between input and output values. Start by drawing coordinate axes with labeled origin and units, then create vectors to represent the function based on input values, connecting input and output points with line segments. Include an input box for the function expression, plot the function graph based on the input, and use dynamic points to illustrate changes in function values. Add labels around the diagram to explain input-output relationships and function properties.
The prompt above was compiled from the original drawing commands and is for reference only.