
Mapping Diagram from Function Table Activity
Loading the math board and drawing, please wait…
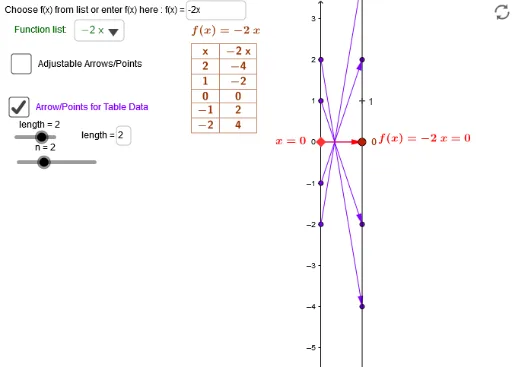
This example demonstrates how to construct a mapping diagram from a function table, highlighting the connection between functions and geometric figures. Key mathematical concepts include coordinate geometry, function graphing, and mapping relationships. Construction involves using GeoGebra commands such as Point, Sequence, Line, and Intersect, along with objects like fnlist and P5. Suitable for high school students or math enthusiasts to understand the integration of functions and geometry, and to enhance geometric construction skills.
GeoGebra Commands & Parameters
Point(y_{axis}) → P5Point(y_{axis}) → P9Point(y_{axis}) → P8Point(y_{axis}) → P7Point(y_{axis}) → P6Point(y_{axis}) → P4Point(y_{axis}) → P3Point(y_{axis}) → P2Point(y_{axis}) → P1SelectedElement(fnlist) → fPoint(yAxis) → AIf(d ≟ 1, y(A) - f(y(A)), 0) → alignVector(A, B) → uTextfield(f) → inputBox1Textfield(length) → inputBox4Sequence(t, t, y(A) + (n * Δx), y(A) - (n * Δx), (-Δx)) → t_*Zip((k, f(k)), k, t_*) → GraphptsZip((0, k), k, t_*) → SourcePtsMDZip(f(k), k, t_*) → ft_*Zip((2, (y_{zoom} * (k + align))), k, ft_*) → TargPtsZip(Vector[(0, k), (2, (y_{zoom} * (m + align)))], k, t_*, m, ft_*) → MDVector(X_1, Y_1) → vLine(A, B) → hIntersect(g, h, (0, 0)) → CZip(Vector[A, B], A, SourcePtsMD, B, TGTpts) → TGTarrTableText(Transpose[{Join[{{"x"}, t_*}], Join[{{f}, ft_*}]}], "|_cc") → text13SelectedElement(fnlist) → pTextfield(g) → inputBox2
AI Drawing Prompt Reference
Draw a mapping diagram showing the relationship between a function table and its graph. Include coordinate points, the function graph, and mapping lines connecting point pairs. The construction should start with coordinate points, then draw the function graph, and finally add mapping lines to connect the points.
The prompt above was compiled from the original drawing commands and is for reference only.