
Mapping Diagram: Complex Analysis - Realign Target
Loading the math board and drawing, please wait…
In collections
Mapping Diagrams to Visualize Complex Analysis
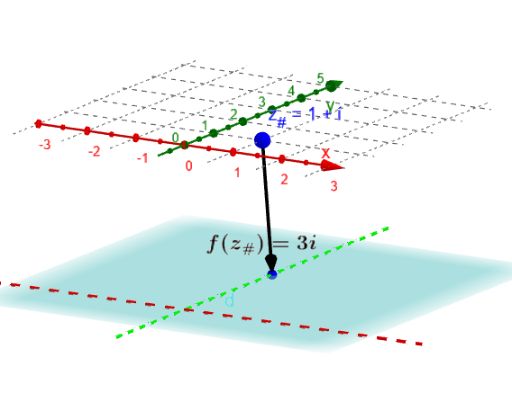
This example demonstrates a mapping diagram in complex analysis, showing the transformation effects of complex functions by realigning target points. Key mathematical concepts include complex numbers, mapping, and transformation. It utilizes commands such as Sequence, Zip, If, Circle, Line, Vector, Point, Locus, and Textfield in GeoGebra. Suitable for university mathematics students and educators.
GeoGebra Commands & Parameters
Sequence(0, m) → MZip(((2 * pi) * k / m), k, M) → t_*Zip((δ * ℯ^((t * ί))) + z_#, t, t_*) → z_*If(e ≟ 1, z_# - fz_#, 0) → alignCircle(z_#, δ) → cZip(f(z) + align, z, z_*) → fz_*Zip((x(z), y(z), ht), z, fz_*) → fpt_*Line(O, ZY1) → YaxLine(O, ZX1) → XaxZip(Vector[A, B], A, z_*, B, fpt_*) → fvec_*Vector(z_#, Fz1_#) → vecf_#Point(c) → A0Locus(PtAF, A0) → fLocIf(e ≟ 1, (x(z_#), y(z_#), ht), (x(fz_#), y(fz_#), ht)) → Alignfz_#Vector(z_#, Alignfz_#) → uTextfield(F) → InputBox1
AI Drawing Prompt Reference
Create a mapping diagram in complex analysis to show the transformation effects of complex functions. Start by plotting a series of complex points, then apply a complex exponential function to these points, reposition the target points based on the transformation, draw circles and lines, and finally connect the origin to the transformed points to illustrate the mapping process.
The prompt above was compiled from the original drawing commands and is for reference only.