
Maclaurin Series for SIN
Loading the math board and drawing, please wait…
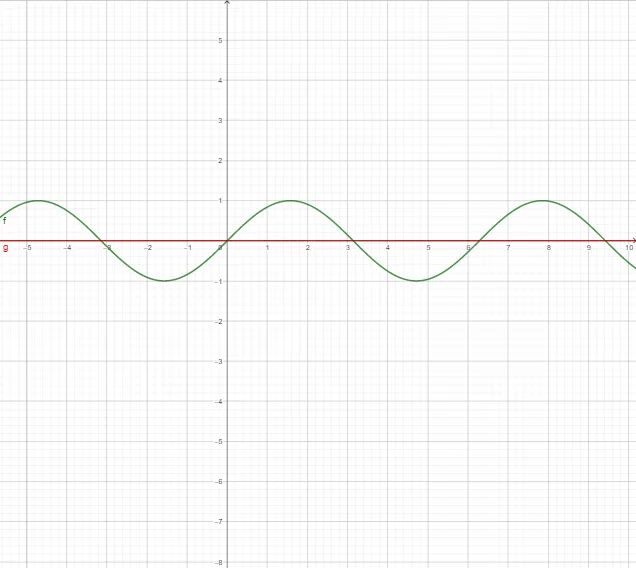
This example demonstrates how to use GeoGebra to plot the Maclaurin series expansion of the sine function. Key mathematical concepts include Taylor series expansion of functions, properties of the sine function, and the approximation effect of series. The construction highlights the use of the GeoGebra command TaylorSeries, where adjusting parameter n shows the approximation by different orders of the series. Suitable for high school and above students to learn and understand the application of Taylor series in calculus.
GeoGebra Commands & Parameters
TaylorSeries(f, 0, n) → g
AI Drawing Prompt Reference
Plot the Maclaurin series expansion of the sine function, using the TaylorSeries command to show the approximation effect of different series orders, and observe how the series approximates the original function.
The prompt above was compiled from the original drawing commands and is for reference only.