
London Eye Height Demo
Loading the math board and drawing, please wait…
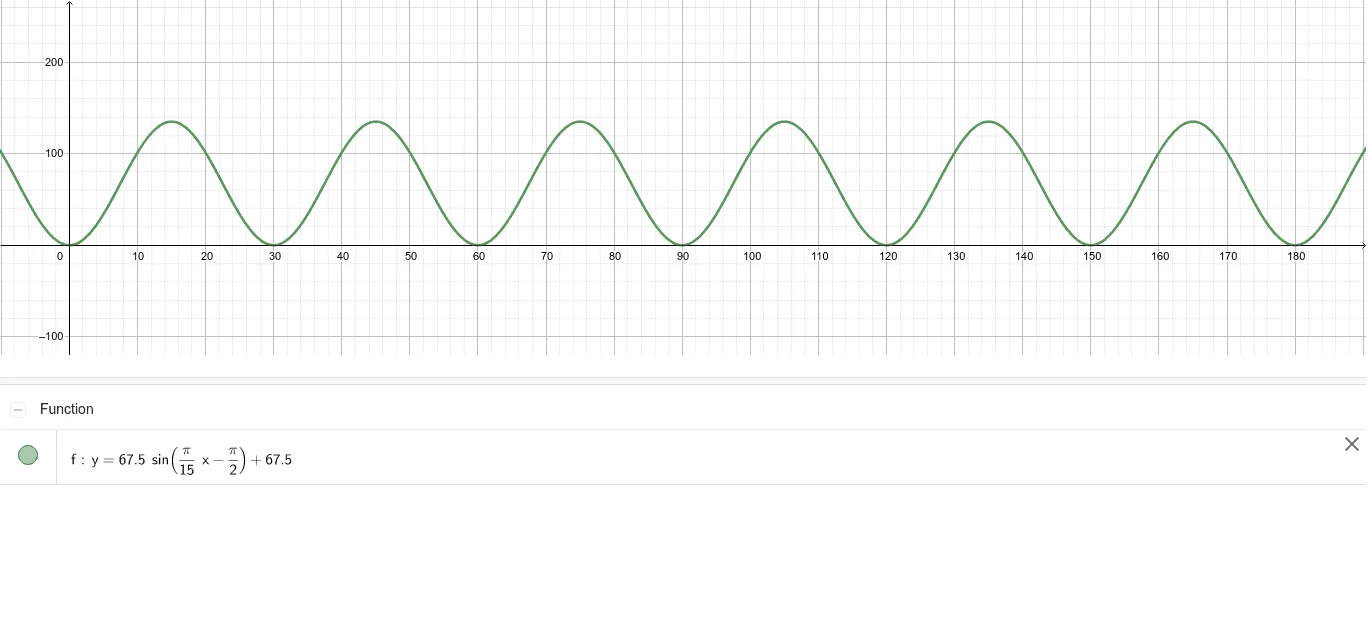
This example demonstrates the height variation of the London Eye. It involves core math concepts like trigonometric functions, function graphing, and statistical characteristics. Constructed using GeoGebra command object f, it is suitable for high school students learning about function graphs and trigonometric applications.
GeoGebra Commands & Parameters
f: y = (67.5 * sin((π / 15 * x) - π / 2)) + 67.5
AI Drawing Prompt Reference
Draw a function graph showing the variation of height with angle, represented by a sine function with amplitude 67.5, period 15, phase shift -π/2, and vertical shift 67.5, creating an oscillating curve to demonstrate the height changes of the London Eye.
The prompt above was compiled from the original drawing commands and is for reference only.