
Logistic Growth Function (ZHAW HS2018 Exercise 6)
Loading the math board and drawing, please wait…
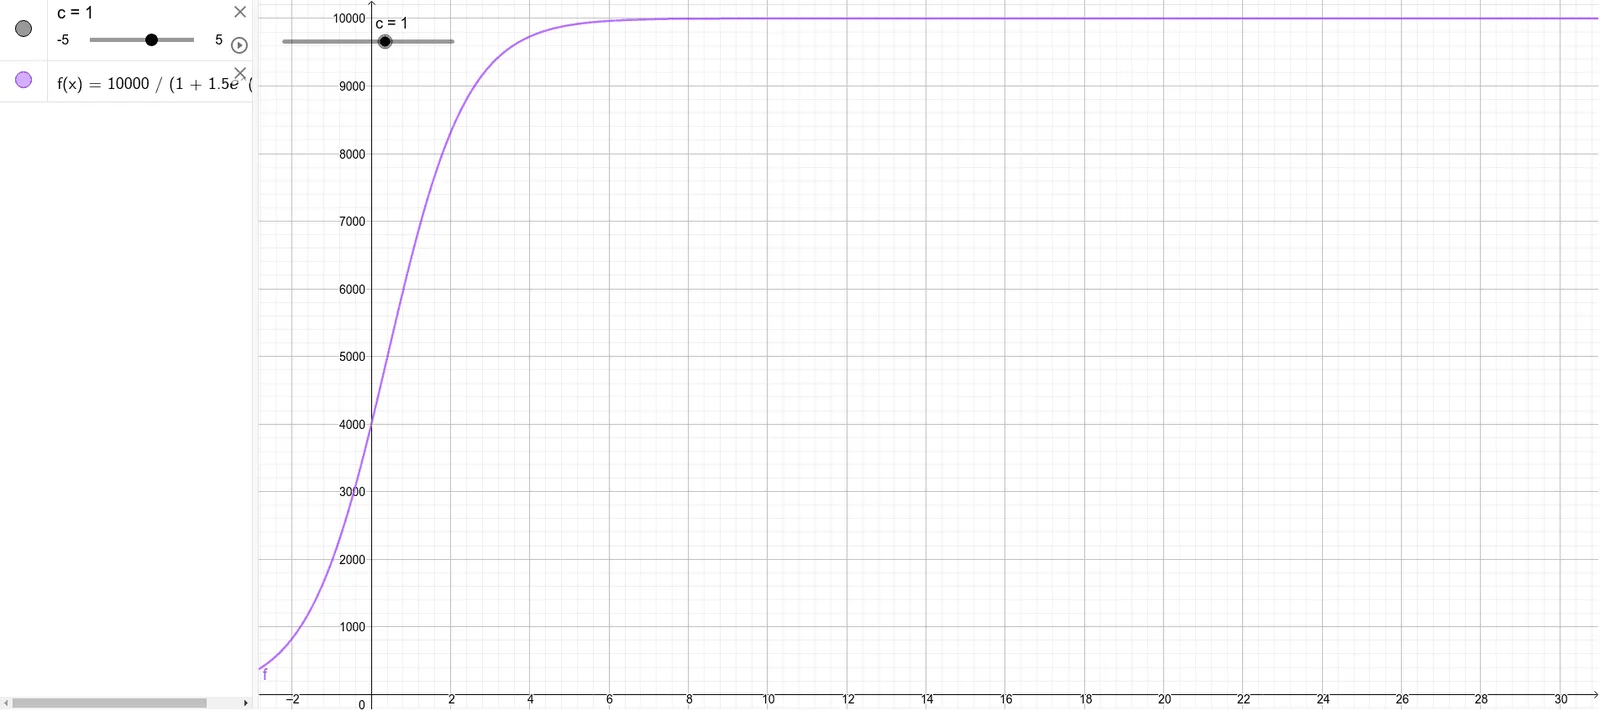
① This example demonstrates the graph and properties of a logistic growth function, showing an S-shaped curve for population or quantity growth under limited resources. ② Core mathematical concepts include exponential functions, function graphs, rate of change, limits (carrying capacity), and difference/slope relationships, introducing basic ideas of differential equations. ③ Construction: Based on the construction summary, objects c and f are used, likely defining a function f and a parameter c (such as growth rate or carrying capacity) to plot the logistic curve, possibly with sliders to explore parameter effects. ④ Suitable for upper secondary or pre-university students learning function modeling, growth models, and introductory calculus, as well as applied mathematics courses analyzing real-world growth problems.
GeoGebra Commands & Parameters
Numeric c(1.0)f(x) = 10000 / (1 + (1.5 * exp(((-c) * x))))
AI Drawing Prompt Reference
Draw the graph of a logistic growth function showing an S-shaped curve, with a parameter to control the growth rate and a limit labeled as carrying capacity, allowing the curve to change by sliding the parameter to illustrate concepts like exponential functions, rates of change, and limits.
The prompt above was compiled from the original drawing commands and is for reference only.