
Logarithmic Inequalities: Dynamic Solving and Graphical Visualization
Loading the math board and drawing, please wait…
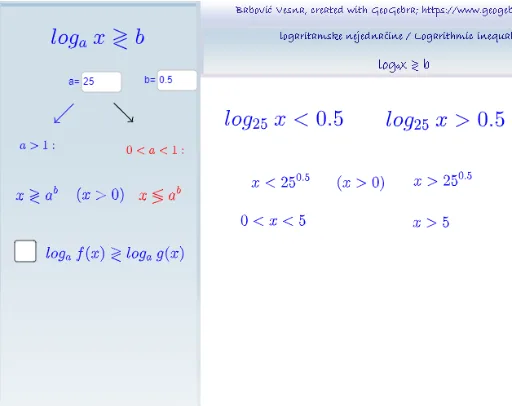
This GeoGebra example demonstrates the solving of logarithmic inequalities through an interactive interface, combining algebraic expressions with function graphs to visually represent solution sets on a number line. Core mathematical concepts include properties of logarithmic functions, inequality solving, interval notation, and the correspondence between function graphs and number lines. Construction highlights: Textfield and InputBox objects allow users to input parameters a and b; log1 and related objects plot the logarithmic function; xvece and xmanje mark solution intervals; arrows (strelical, strelicad) and text labels (textavece, textamanje) indicate direction; background objects (pozadina1, pozadina2) organize layout; grom objects may serve as emphasis or decoration. Suitable for high school or pre-university students learning logarithmic inequalities, helping them explore how changing the base affects inequality direction and solution sets dynamically.
GeoGebra Commands & Parameters
Textfield(a) → InputBoxaTextfield(b) → InputBoxb
AI Drawing Prompt Reference
Draw a dynamic solution graph for a logarithmic inequality, including input boxes for parameters a and b, plot the logarithmic function, mark solution intervals xvece and xmanje, use arrows strelical and strelicad to indicate directions, add background objects pozadina1 and pozadina2 to organize the layout, and show how changing the base affects the inequality direction and solution set.
The prompt above was compiled from the original drawing commands and is for reference only.