
Logarithmic Function Demonstration
Loading the math board and drawing, please wait…
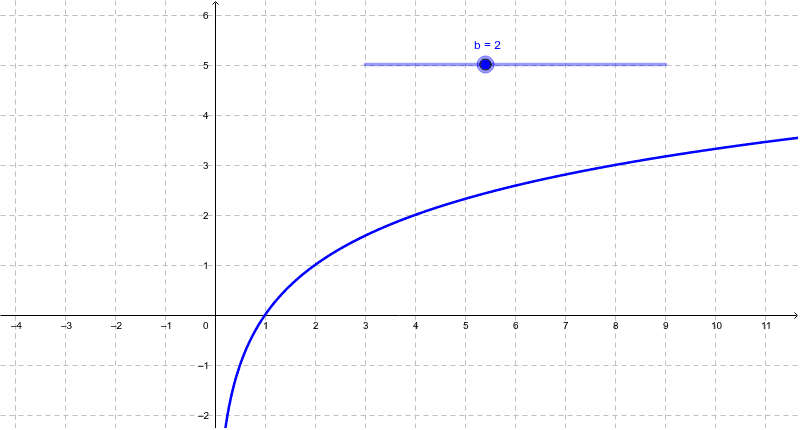
This example demonstrates the logarithmic function y = log base b (x), showing how the graph changes with variations in the base 'b'. Key mathematical concepts include logarithmic functions, the effect of base changes on function graphs, and fundamental properties of logarithmic graphs. It utilizes GeoGebra commands involving objects 'b' (base slider) and 'f' (function graph). Suitable for high school mathematics education to help students understand the nature of logarithmic functions and the control exerted by the base on the function's graph.
GeoGebra Commands & Parameters
Numeric b(2.0)f(x) = log(b, x)