
Logarithm Graph Investigation: Rotation, Differential Equations, and Linear Regr
Loading the math board and drawing, please wait…
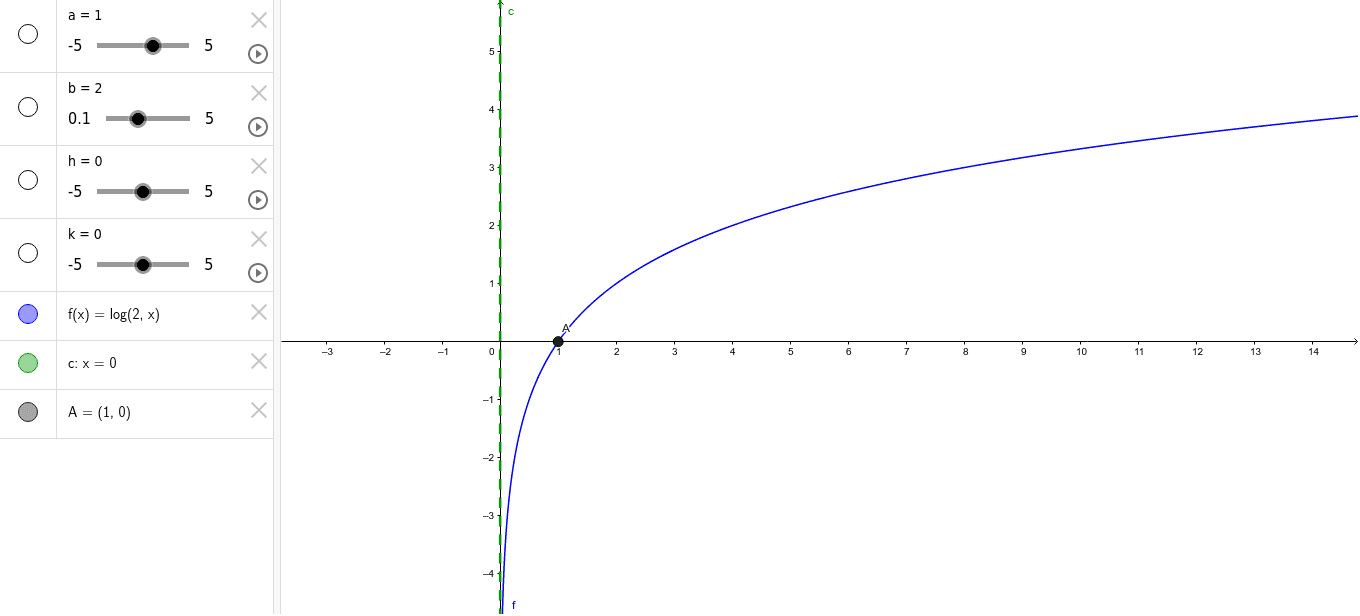
①This interactive GeoGebra example explores the logarithmic function graph under multiple mathematical perspectives, including rotation, differential equations, and linear regression, allowing learners to visualize how the curve changes with parameters. ②Core concepts include logarithmic functions, curve rotation, differential equations (e.g., exponential growth/decay), linear regression fitting, and intersection points between curves and lines. ③Construction uses the Intersect command on objects a, b, h, k, f, c, and A, where a and b may be parameters or lines, h and k are translations, f is the logarithmic function, c is a rotated or regression line, and A is the intersection point; sliders or input boxes dynamically adjust parameters to observe graph transformations. ④Suitable for high school to early college students for inquiry-based learning on function transformations, differential equation modeling, or data fitting, and as a classroom demonstration tool for teachers.
GeoGebra Commands & Parameters
Intersect(f, xAxis, (0.9999999999999998, -3.2034265038149186E-16)) → A