
Linearization of the Logistic Map
Loading the math board and drawing, please wait…
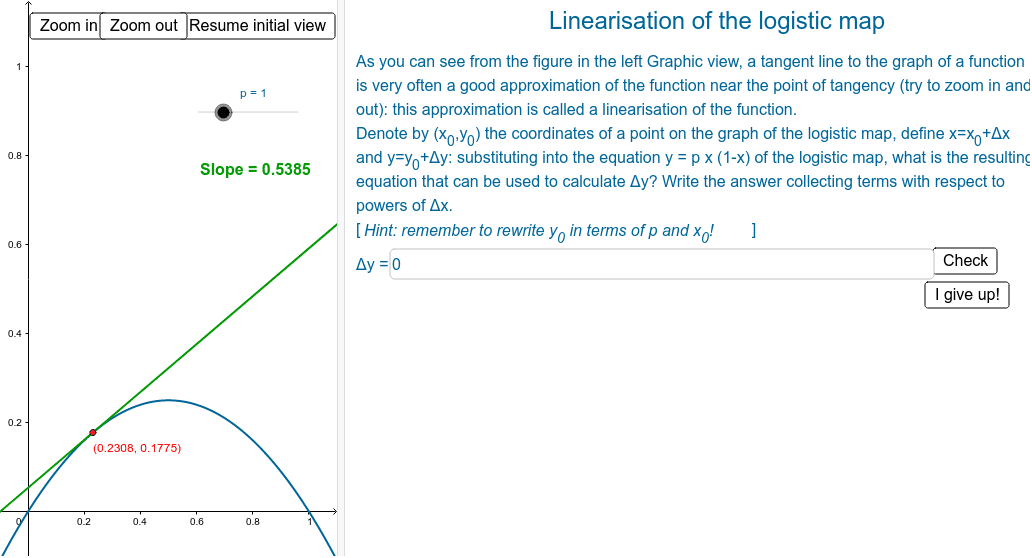
This example demonstrates how to approximate a function (e.g., the logistic map) with its tangent line near the point of tangency. It involves core math concepts like tangent lines, derivatives, and linear approximation. Constructed using GeoGebra commands such as Point, Tangent, Textfield, and Slope. Suitable for high school and above students to understand local linearization of functions and its applications.
GeoGebra Commands & Parameters
Point(f) → PTangent(P, f) → aTextfield(r) → inputBox1Slope(a) → sl
AI Drawing Prompt Reference
Draw a graph of the logistic map function. Place a point on the curve as the point of tangency, and draw the tangent line to the curve at that point, showing its slope. Include an input text box for adjusting a parameter (such as the logistic map's parameter); when the parameter changes, the curve and tangent line update accordingly, demonstrating the linear approximation near the tangency point. The graph should include coordinate axes, the function curve, the tangency point, the tangent line, and a display of the slope value.
The prompt above was compiled from the original drawing commands and is for reference only.