
Linear vs. Exponential Models
Loading the math board and drawing, please wait…
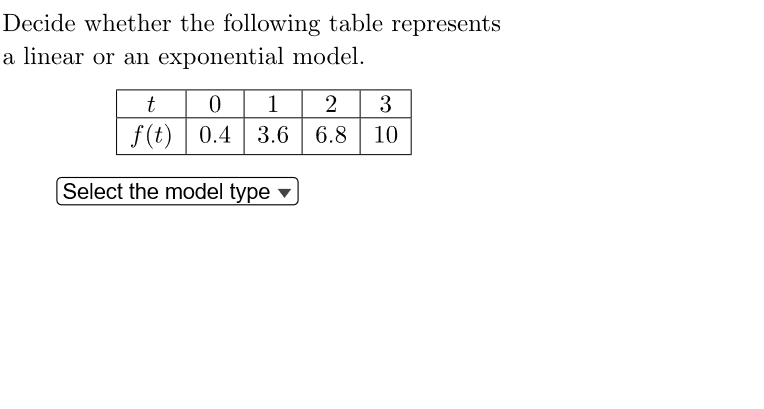
This example demonstrates the comparison between linear and exponential models based on different data points. Key math concepts include linear functions, exponential functions, scatter plots, quadratic functions, conditional probability, random experiments, and 2D vectors. It is constructed using GeoGebra commands like Random and SelectedIndex, along with objects such as choice, text1 to text8, ddmenu, check, cross, is, button1, linFun, and correct. Suitable for high school mathematics education to help students understand the characteristics and applicable scenarios of different function models.
GeoGebra Commands & Parameters
Random(1, 8) → choiceSelectedIndex(ddmenu) → is
AI Drawing Prompt Reference
Create a math comparison scene contrasting linear and exponential models. First use a random choice from 1 to 8 to determine which data-point index will be used. Then provide a selectable index/option control so the current selection drives the displayed model comparison logic. The visual should relate scatter plot data to both linear and exponential function behavior, emphasizing their characteristic differences, and include clear text annotations of the key ideas for high-school modeling and understanding.
The prompt above was compiled from the original drawing commands and is for reference only.