
Linear Regression & Parabola Construction
Loading the math board and drawing, please wait…
In collections
Geometry of Angles (Student Created)
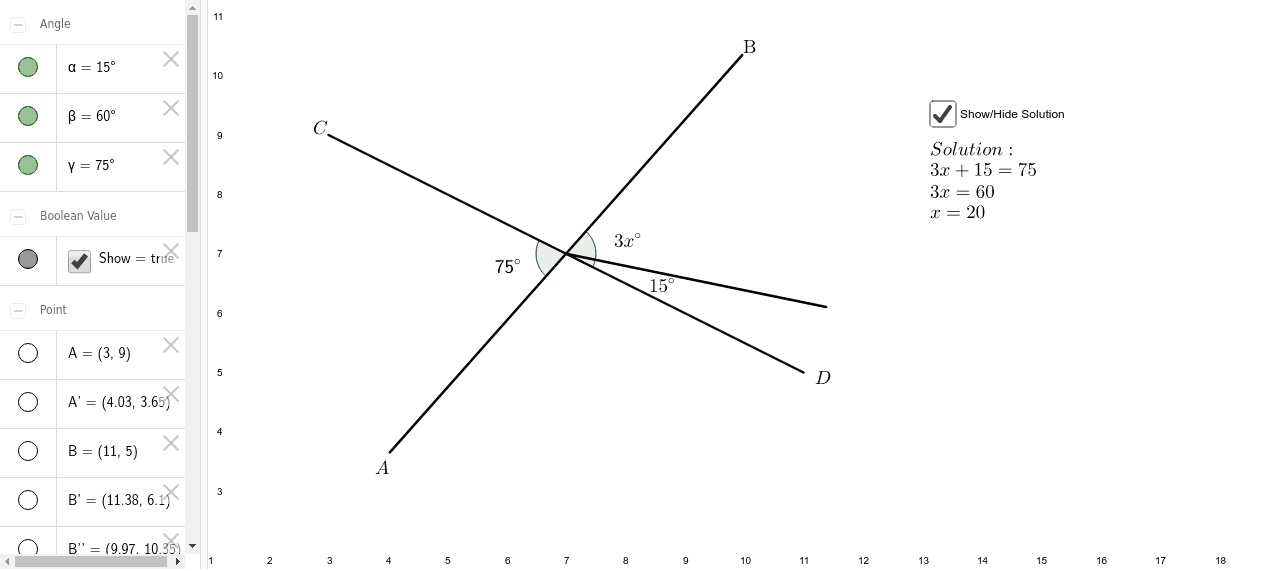
This example demonstrates constructing linear regression models and parabolas using GeoGebra, analyzing their geometric relationships. Key math concepts include linear regression, parabolas, coordinate geometry, and function graphing. Construction highlights the use of commands like Segment, Midpoint, Rotate, and Angle. Suitable for high school and above, focusing on the integration of data analysis and geometric transformations.
GeoGebra Commands & Parameters
Segment(A, B) → aMidpoint(a) → CRotate(B, 15*°, C) → B'Angle(B, C, B') → αSegment(C, B') → bRotate(B', 60*°, C) → B''Angle(B', C, B'') → βSegment(C, B'') → cRotate(A, 75*°, C) → A'Angle(A, C, A') → γSegment(C, A') → d
AI Drawing Prompt Reference
Draw a line segment, find its midpoint, rotate one endpoint around the midpoint by 15 degrees to get a new point, and connect the midpoint to this new point. Then, rotate the previous line segment around the new point by 60 degrees to get another new point, and connect the midpoint to this new point. Next, rotate the original line segment's starting point around the midpoint by 75 degrees to get another new point, and connect the midpoint to this new point. Finally, display these line segments and angles, analyzing their geometric relationships and functional graph representations.
The prompt above was compiled from the original drawing commands and is for reference only.