
Linear Regression & Function Graphs Demo
Loading the math board and drawing, please wait…
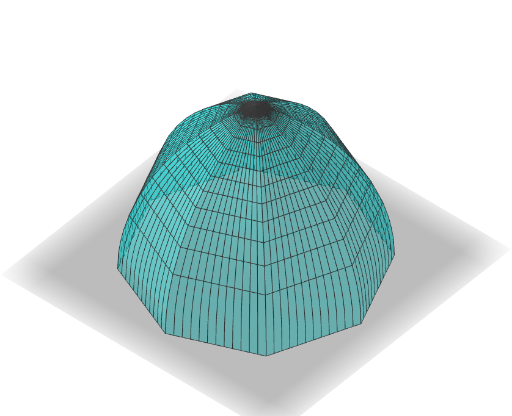
This example demonstrates linear regression, sine functions, matrix operations, power functions, and quadratic functions, showcasing their graphical representations and variations. Key math concepts include linear regression models, trigonometric properties, matrix computations, function graph transformations, and quadratic function characteristics. The construction uses GeoGebra's Sequence command to generate sequences and objects like c, a, nc, n, f, liste1 for function plotting and parameter control. Suitable for high school mathematics teaching, focusing on function graphing, parameter influence analysis, and introductory mathematical modeling.
GeoGebra Commands & Parameters
Sequence(Surface[((((u * a) * (1 - v)) + (((v * u) * a) * cos((2 * π / nc)))) * cos(i)) - ((((sin(i) * v) * u) * a) * sin((2 * π / nc))), ((((u * a) * (1 - v)) + (((v * u) * a) * cos((2 * π / nc)))) * sin(i)) + ((((cos(i) * v) * u) * a) * sin((2 * π / nc))), f((u * a)), u, 0, 1, v, 0, 1], i, 0, (((n - 1) * 2) * π / nc), (2 * π / nc)) → liste1