
Linear Regression Exploration: Fitted Line and Correlation Coefficient
Loading the math board and drawing, please wait…
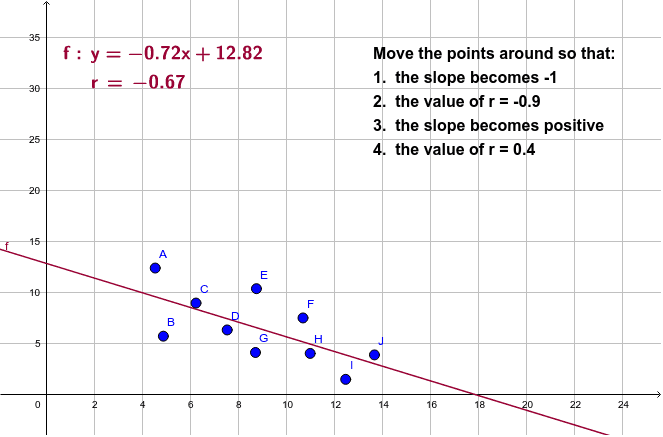
① This GeoGebra example demonstrates the process of fitting a least-squares regression line to a set of scatter points, and visualizes the Pearson product-moment correlation coefficient (PMCC) as a measure of fit quality. ② Core mathematical concepts include linear regression, least-squares method, correlation coefficient, fitted line equation, and residuals between data points and the line. ③ Construction highlights: the FitLineY command is used on a list of points (list1) to generate the fitted line f; the PMCC command computes the correlation coefficient r; LaTeX text objects (text1, text2, text3) display the regression equation and r value; points A through J are draggable data points, allowing dynamic exploration of how data changes affect the fit. ④ Suitable for high school to early college statistics and data analysis courses, as well as inquiry-based math labs, helping learners grasp the geometric meaning of regression lines and statistical indicators.
GeoGebra Commands & Parameters
FitLineY(list1) → fLaTeX(f, true, true) → text1PMCC(list1) → rLaTeX(r, true, true) → text2