
Linear Regression Example 3
Loading the math board and drawing, please wait…
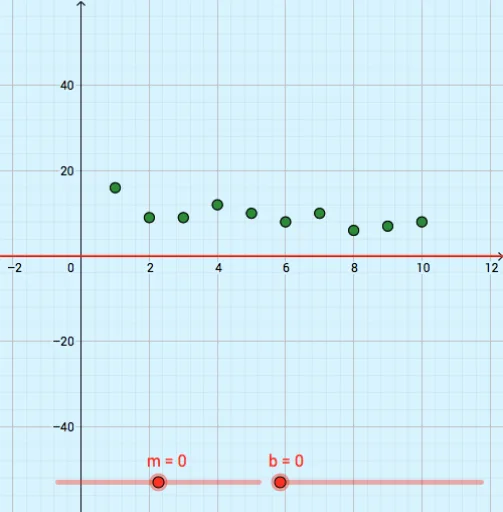
This example demonstrates a linear regression case, involving core mathematical concepts such as linear regression and residual plots. Using GeoGebra commands like FitPoly, PMCC, Mean, and ResidualPlot, a linear regression model can be constructed. Suitable for high school math education.
GeoGebra Commands & Parameters
FitPoly(L_3, 1) → fPMCC(L_3) → aMean(L_2) → b_1ResidualPlot(L_3, f) → L_5ResidualPlot(L_3, h) → L_4
AI Drawing Prompt Reference
Create a linear regression example showing data points and a fitted linear function, along with two residual plots. First, plot a set of data points and fit a linear function to them, labeling it. Then, calculate the mean of the data points and generate two residual plots, one for the original data and one for the fitted function, to display the error distributions.
The prompt above was compiled from the original drawing commands and is for reference only.