
Linear Regression and Statistical Graphs
Loading the math board and drawing, please wait…
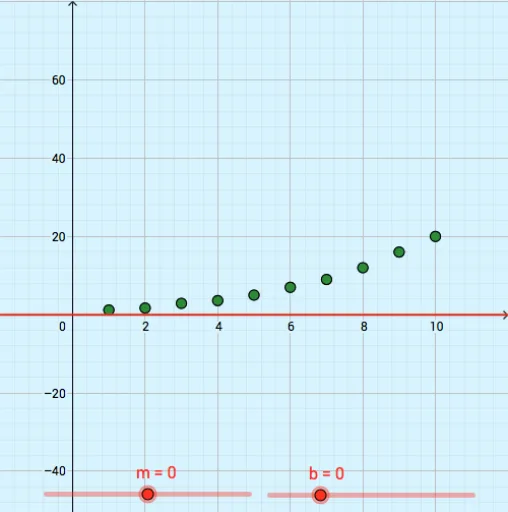
This example demonstrates how to perform linear regression analysis using GeoGebra, visualizing scatter plots, fitted lines, residual plots, and other statistical graphs. Core math concepts include linear regression, Pearson's correlation coefficient (PMCC), mean calculation, residual analysis, and confidence intervals. The construction leverages commands like FitPoly for polynomial fitting, PMCC for correlation, Mean for average, and ResidualPlot for residual visualization, utilizing objects such as L_1 to L_5, f, a, b_1, g, m, b, h, along with xMin, xMax, yMin, yMax. Suitable for high school mathematics education to understand data fitting and basic statistical methods.
GeoGebra Commands & Parameters
FitPoly(L_3, 1) → fPMCC(L_3) → aMean(L_2) → b_1ResidualPlot(L_3, f) → L_5ResidualPlot(L_3, h) → L_4