
Linear Regression & Isosceles Triangles GeoGebra Example
Loading the math board and drawing, please wait…
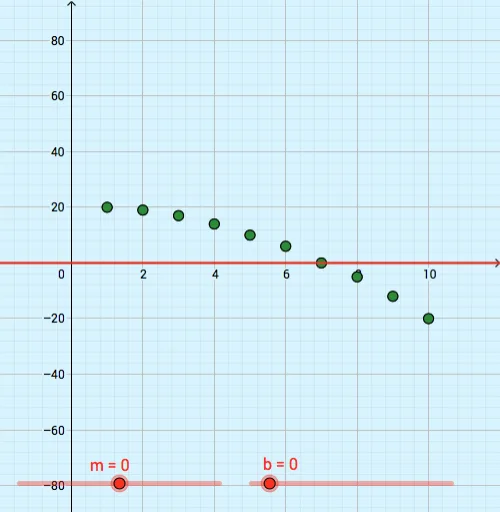
This example demonstrates the application of linear regression in isosceles triangles and explores the relationship between sine functions and sequences/series using GeoGebra. Key math concepts include linear regression, properties of isosceles triangles, sine functions, sequences and series, rational numbers, and expected value. Construction highlights involve GeoGebra commands like FitPoly for polynomial fitting, PMCC for correlation coefficient, Mean for average calculation, and ResidualPlot for residual analysis, utilizing objects such as L_1 to L_5, f, a, b_1, g, m, b, h, and bounds like xMin, xMax, yMin, yMax, min, max. Suitable for high school mathematics education, combining data analysis with geometric图形 applications.
GeoGebra Commands & Parameters
FitPoly(L_3, 1) → fPMCC(L_3) → aMean(L_2) → b_1ResidualPlot(L_3, f) → L_5ResidualPlot(L_3, h) → L_4
AI Drawing Prompt Reference
Draw a graph showing linear regression and isosceles triangles, including data points, a fitted linear function, and residual plots, with correlation coefficient and mean values labeled, exploring relationships between trigonometric functions, sequences, and series for high school mathematics education.
The prompt above was compiled from the original drawing commands and is for reference only.