
Linear Regression Calculator
Loading the math board and drawing, please wait…
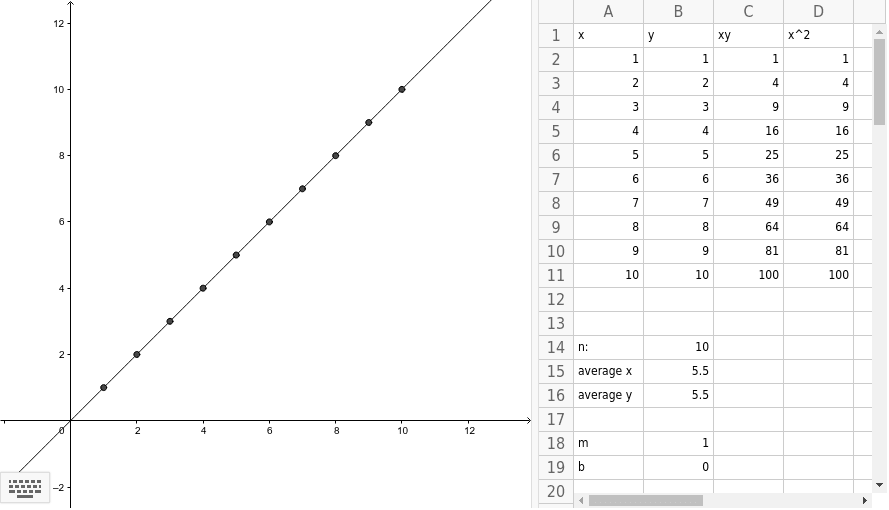
This GeoGebra example is an interactive Linear Regression Calculator designed to demonstrate how to fit a best-fit straight line to a set of scatter data points. The core mathematical concepts involved include linear regression, the method of least squares, correlation coefficients, and statistical distributions. Looking at the construction summary, the model utilizes a structured grid of point objects (ranging from A1 to D2) to represent input variables, scatter observations, and calculated regression parameters, facilitating a dynamic visual link between algebraic formulas and geometric plots. It is highly suitable for high school statistics courses, college-level data science introductions, and anyone needing an intuitive visual tool to grasp the mechanics of linear predictive modeling and data fitting.
GeoGebra Commands & Parameters
Numeric A2(1.0)Numeric B2(1.0)Numeric A3(2.0)Numeric A4(3.0)Numeric A5(4.0)Numeric A6(5.0)Numeric A7(6.0)Numeric A8(7.0)Numeric A9(8.0)Numeric A10(9.0)Numeric A11(10.0)Numeric B3(2.0)Numeric B4(3.0)Numeric B5(4.0)Numeric B6(5.0)Numeric B7(6.0)Numeric B8(7.0)Numeric B9(8.0)Numeric B10(9.0)Numeric B11(10.0)(A2 * B2)(A3 * B3)(A4 * B4)(A5 * B5)(A6 * B6)(A7 * B7)(A8 * B8)(A9 * B9)(A10 * B10)(A11 * B11)(A2 * A2)(A3 * A3)(A4 * A4)(A5 * A5)(A6 * A6)(A7 * A7)(A8 * A8)(A9 * A9)(A10 * A10)(A11 * A11)Numeric B14(10.0)Sum[A2:A11] / B14Sum[B2:B11] / B14(Sum[C2:C11] - ((B14 * B15) * B16)) / (Sum[D2:D11] - ((B14 * B15) * B15))B16 - (B18 * B15)(A2, B2)(A3, B3)(A4, B4)(A5, B5)(A6, B6)(A7, B7)(A8, B8)(A9, B9)(A10, B10)(A11, B11){P_1, P_2, P_3, P_4, P_5, P_6, P_7, P_8, P_9, P_{10}}f(x) = (B18 * x) + B19
AI Drawing Prompt Reference
Create a visual of an interactive linear regression calculator: start by plotting a set of ten scatter points representing paired data values; then compute and draw the best‑fit straight line through these points, showing its slope and intercept; optionally add labels for the correlation coefficient and means to illustrate the underlying statistical calculations. Include a clear grid background with labeled axes for the independent and dependent variables, and a legend that identifies the regression line.
The prompt above was compiled from the original drawing commands and is for reference only.