
Linear Regression and Secant Line Demo
Loading the math board and drawing, please wait…
In collections
Geometry of Angles (Student Created)
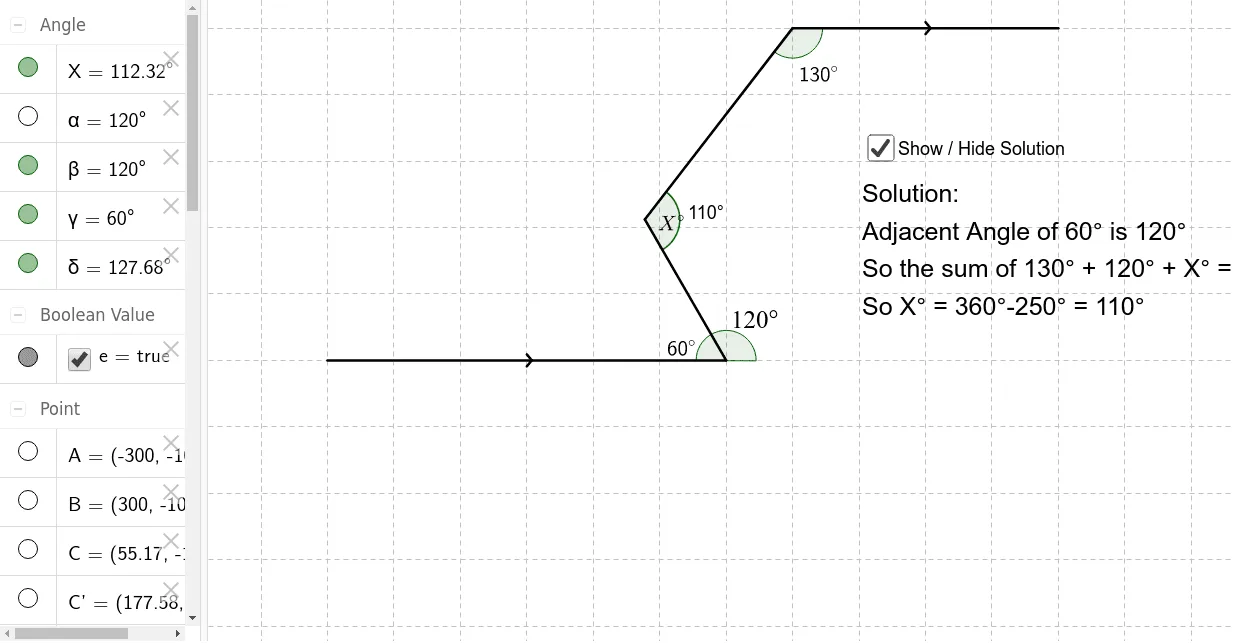
This example demonstrates the application of linear regression models and secant lines on function graphs. It involves core math concepts like linear regression, secant, functions, median value, and sine. Construction highlights include commands like Segment, Point, Rotate, Angle. Suitable for high school mathematics teaching to understand function fitting and geometric transformations.
GeoGebra Commands & Parameters
Segment(A, B) → aPoint(a) → CRotate(C, 300*°, B) → C'Segment(C', B) → bSegment(D, E) → cRotate(F, 230*°, D) → F'Segment(D, C') → dAngle(B, C', D) → XAngle(C', B, C) → γAngle(C', D, E) → δRotate(H, 120*°, I) → H'Angle(H, I, H') → αRotate(H, 120*°, I) → H'_1Angle(H, I, H'_1) → β
AI Drawing Prompt Reference
Draw a function graph and add a secant line and a regression line. First, plot two points A and B on the graph and connect them to form segment a. Then, take a point C on segment a and rotate it 300 degrees around point B to get point C', and connect C' and B to form segment b. Next, draw another segment c and rotate it 230 degrees around point D to get point F', and connect D and C' to form segment d. Finally, measure and label angles X, γ, δ, α, and β.
The prompt above was compiled from the original drawing commands and is for reference only.