
Linear Inequalities - Lesson 1
Loading the math board and drawing, please wait…
In collections
Inequalities Digi Project WIP
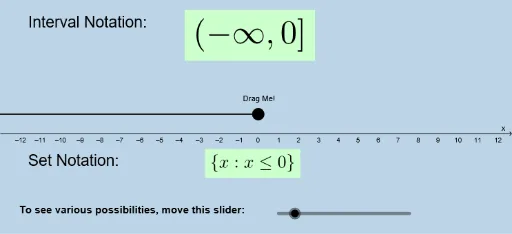
This GeoGebra example demonstrates the graphical representation of linear inequalities in the Cartesian plane, showing how boundary lines divide the plane into half-planes and how the solution set is shaded or indicated. The core mathematical concepts include linear inequalities, boundary lines, half-planes, and the geometric interpretation of solution regions. Construction details: the example uses Segment and Ray commands to create boundary lines, with multiple points (A, B, C, D, E, F) and function objects (f, g) defining the inequality edges; text objects (text1 through text21) label key features, and a button (button1) likely enables interactive step-by-step exploration. Suitable for upper middle school or high school students (grades 9-10) as an introductory lesson bridging algebra and geometry, and useful for teachers demonstrating concepts or for self-paced learning.
GeoGebra Commands & Parameters
Segment(A, B) → gSegment((x(A) + 0.3, 1), (x(B) - 0.3, 1)) → jRay((x(A) - 0.3, 1), (x(D), y(D))) → iRay((x(B) + 0.3, 1), (x(C), y(C))) → hRay((x(A) + 0.3, 1), (x(C), y(C))) → k