
Lesson 3 Quadratic Inequalities Part I
Loading the math board and drawing, please wait…
In collections
Inequalities Digi Project WIP
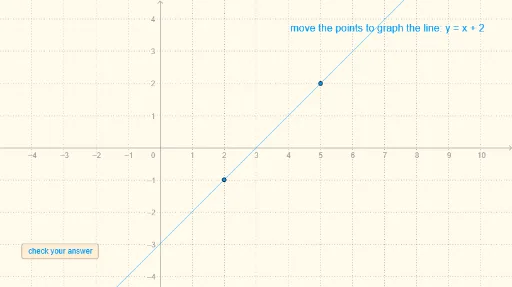
This example demonstrates how to use GeoGebra to graph and analyze quadratic inequalities. Key math concepts include solution sets of inequalities, median value, integer operations, etc. Construction highlights the use of commands like Random, Line, If, and objects such as m, b_1, a, d. Suitable for high school mathematics teaching and self-learning, helping students visually understand the graphs and properties of quadratic inequalities.
GeoGebra Commands & Parameters
Random(-5, 5) → mRandom(-5, 5) → b_1Line(A, B) → bIf(a ≟ b, 1, 0) → n