
Linear Inequalities in Slope-Intercept (Fractions for Slope)
Loading the math board and drawing, please wait…
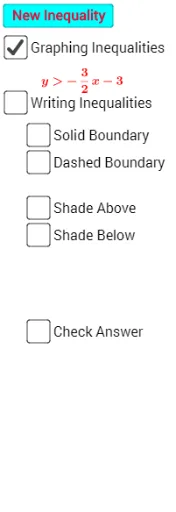
This GeoGebra example demonstrates how to graph linear inequalities in slope-intercept form (y = mx + b), with a special focus on fractional slopes. It illustrates the shading of solution regions, the use of solid or dashed boundary lines, and how changing the slope and intercept affects the inequality graph. Key mathematical concepts include linear inequalities, slope, y-intercept, and region representation. The construction uses Textfield and Line commands, along with InputBoxes and sliders (m_1, b_1, etc.) to allow dynamic input of parameters, and lists to manage multiple inequality examples. It is suitable for middle and high school students learning about linear inequalities, and can be used for classroom demonstrations or self-paced exploration of fractional slopes.
GeoGebra Commands & Parameters
Textfield(m) → InputBox1Textfield(b) → InputBox2Line(A, B) → g_1Line(A, B) → h_1