
Linear Inequalities by Ashmita
Loading the math board and drawing, please wait…
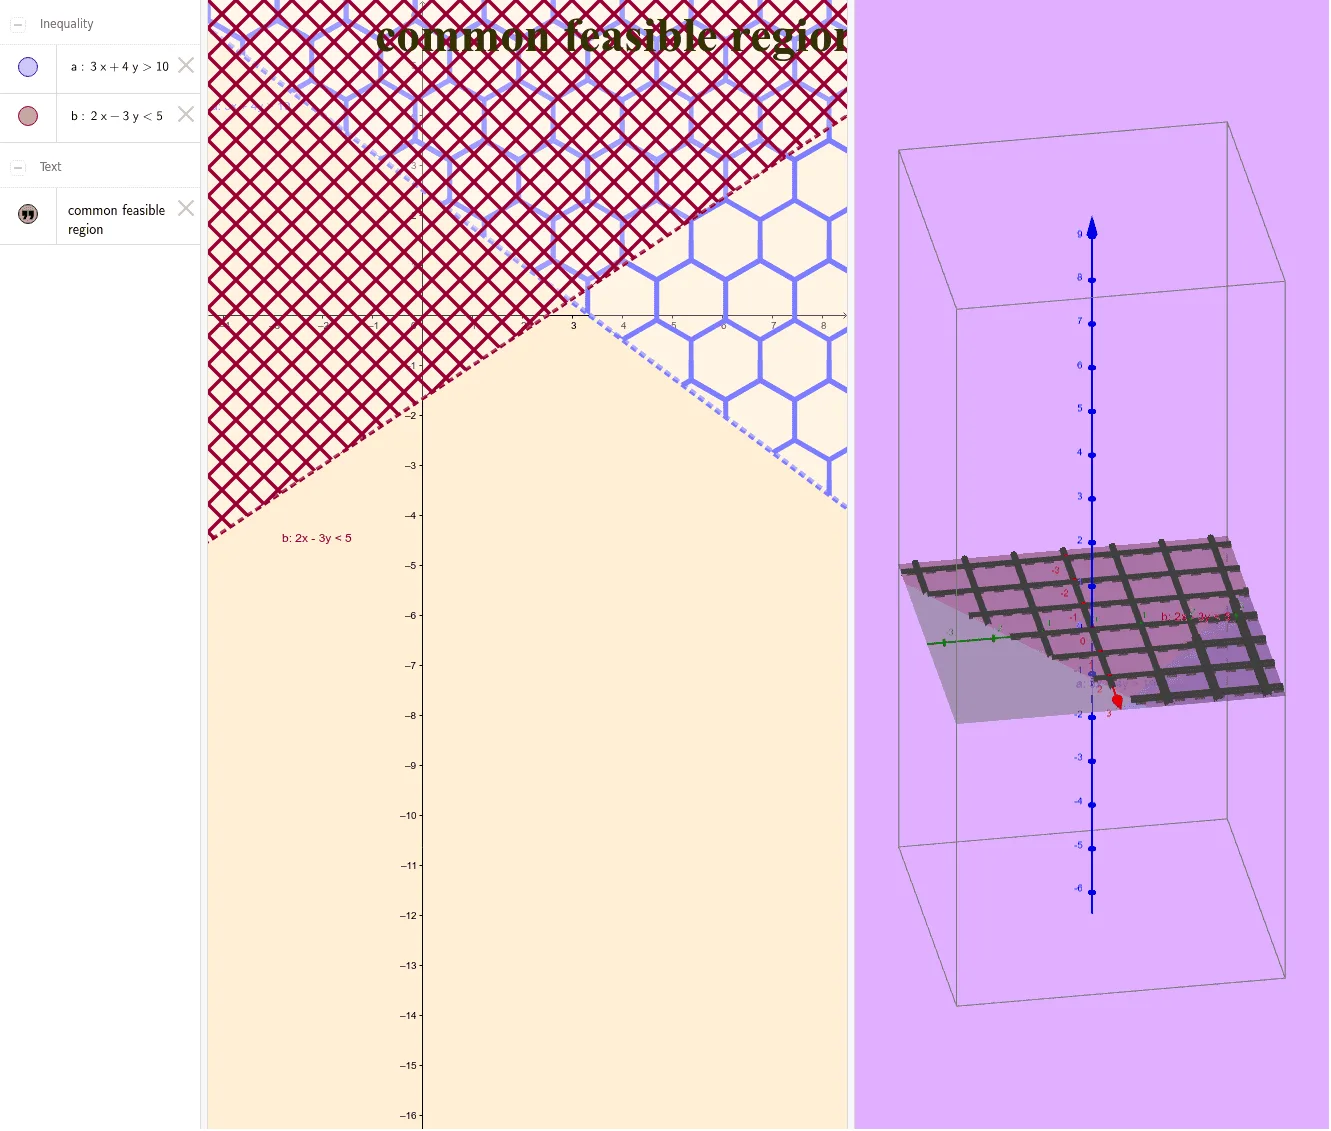
This example demonstrates the graphical representation of linear inequalities. It involves the core mathematical concepts of linear inequalities and their representation in the Cartesian coordinate system. The construction uses GeoGebra commands to create the boundary line of the linear inequality and to show the region representing the solution set. Suitable for students in middle school and above to learn the geometric meaning of linear inequalities.
GeoGebra Commands & Parameters
a(x, y) = (3 * x) + (4 * y) > 10b(x, y) = (2 * x) - (3 * y) < 5
AI Drawing Prompt Reference
Draw the lines 3x + 4y > 10 and 2x - 3y < 5 and indicate their solution regions.
The prompt above was compiled from the original drawing commands and is for reference only.