
Linear Independence
Loading the math board and drawing, please wait…
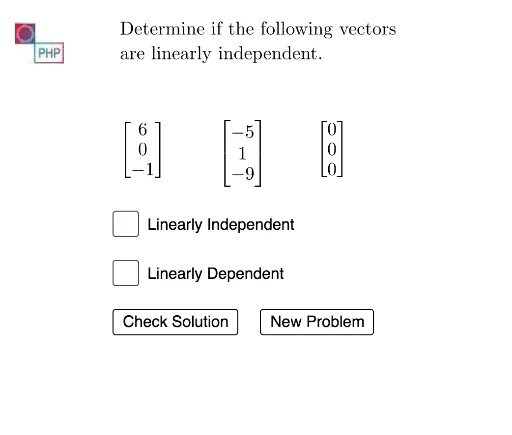
This GeoGebra example demonstrates the concept of linear independence by computing the reduced row echelon form of a matrix formed by vector coordinates. Using Random, If, and RREF commands alongside adjustable scalar and point objects, it visually determines when a set of vectors is linearly independent. The interactive construction is suitable for high school and early university linear algebra courses, helping learners connect matrix operations with vector space geometry.
GeoGebra Commands & Parameters
Random(-9, 9) → a1Random(-2, 2) → scale3Random(-2, 2) → scale2Random(-2, 2) → scale1Random(-9, 9) → b1Random(0, 1) → testRandom(-9, 9) → a2Random(-9, 9) → a3If(test ≟ 0, (scale1 * a1) + (scale2 * b1), (scale1 * a1) + (scale2 * b1) + scale3) → c1Random(-9, 9) → b2Random(-9, 9) → b3If(test ≟ 0, (scale1 * a2) + (scale2 * b2), (scale1 * a2) + (scale2 * b2) + scale3) → c2If(test ≟ 0, (scale1 * a3) + (scale2 * b3), (scale1 * a3) + (scale2 * b3) + scale3) → c3ReducedRowEchelonForm({{a1, a2, a3}, {b1, b2, b3}, {c1, c2, c3}}) → M_1
AI Drawing Prompt Reference
Draw a graph showing three vectors represented by random coordinate points. Include a matrix displaying their linear combinations. Users can adjust scalar and test values to observe linear independence. The graph should visually demonstrate geometric relationships in vector space to help understand the concept.
The prompt above was compiled from the original drawing commands and is for reference only.