
Linear Functions: Slope-Intercept Form
Loading the math board and drawing, please wait…
In collections
Test 3 Review Activities
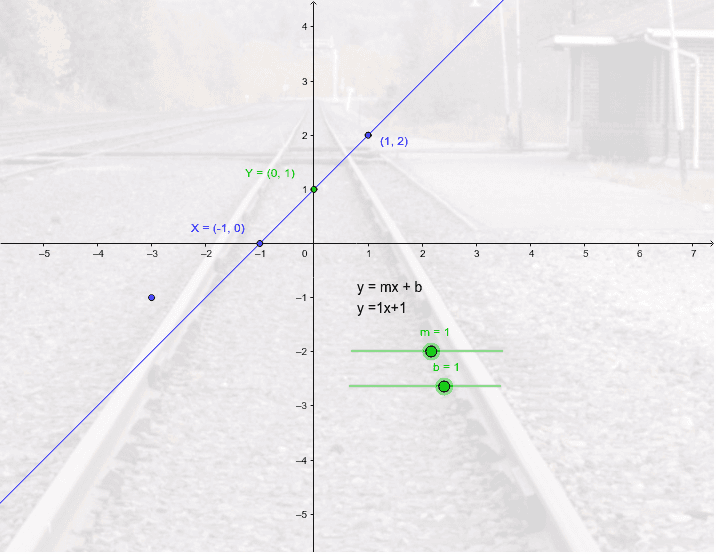
This example allows students to experiment with the slope and y-intercept of a line using sliders, observing how the graph changes. It demonstrates linear functions, slope, and y-intercept. Constructed using GeoGebra objects: b (slope), m (slope), Y (y-axis), f (function), X (x-axis), A (point), text1 (text), B (point), pic1 (picture). Suitable for middle school and above students to learn properties of linear functions and graphical transformations, ideal for classroom instruction or self-study.
GeoGebra Commands & Parameters
Numeric b(1.0)Numeric m(1.0)(0, b)f(x) = (m * x) + b(((-b)) / m, 0)Point A(-3.0, -1.0)(1, f(1))
AI Drawing Prompt Reference
Draw a line with sliders for slope and y-intercept, showing the equation and graph. Mark the origin and y-intercept point on the coordinate system, and label the slope value. The line passes through the origin and y-intercept point, with corresponding function value points on the x-axis.
The prompt above was compiled from the original drawing commands and is for reference only.