
Linear Functions and Optimization
Loading the math board and drawing, please wait…
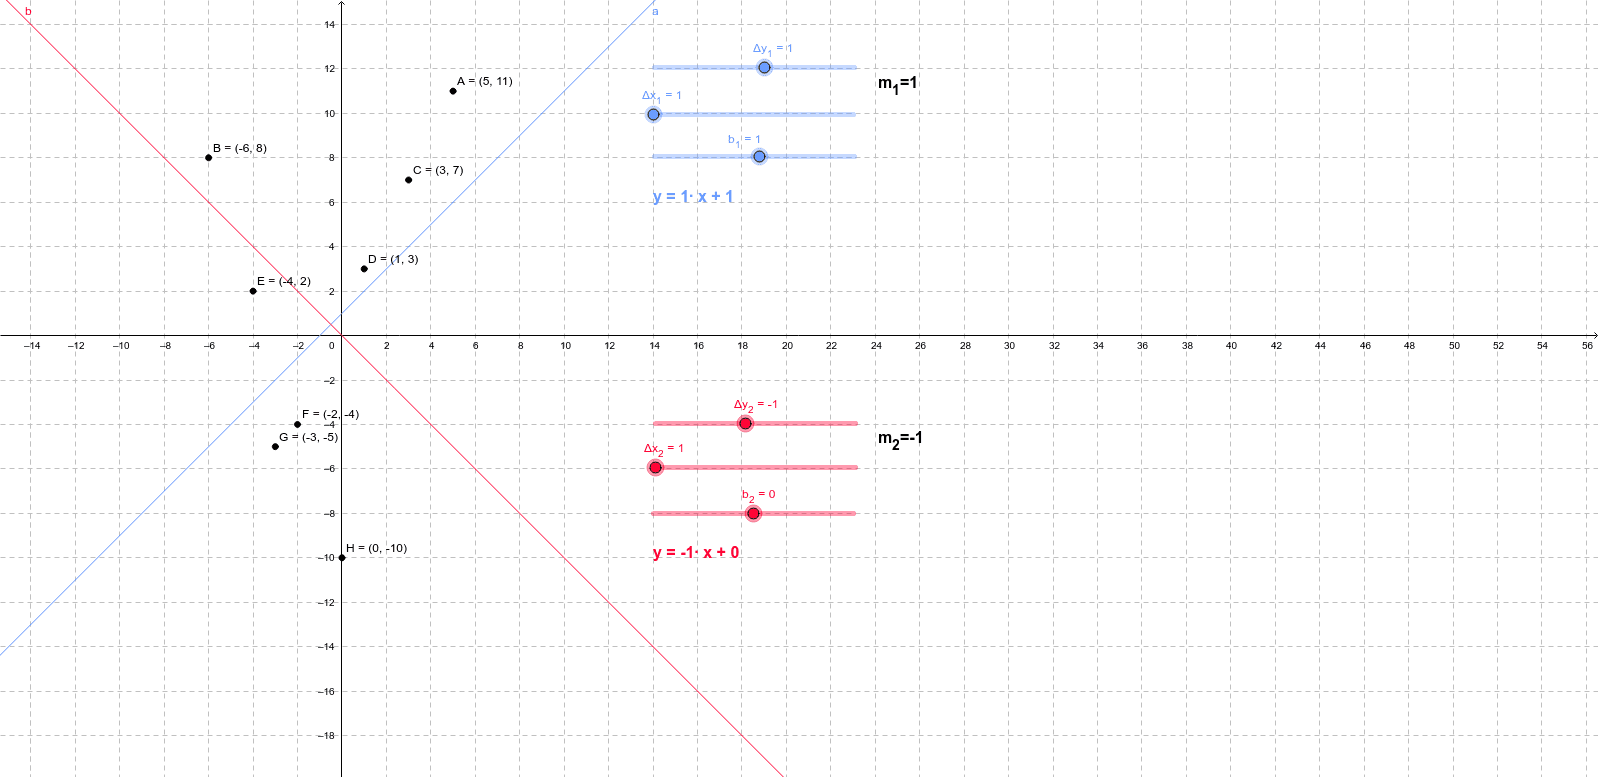
This example demonstrates the graphical representation of linear functions and their application in optimization problems. Key mathematical concepts include linear functions, slope, intercept, and function graphs. Construction involves GeoGebra commands such as Textfield, inputBox, Δy_1, Δx_1, m_1, b_1, etc. to create function parameters and graphs. Suitable for middle or high school mathematics learners to understand basic properties and practical applications of linear functions.
GeoGebra Commands & Parameters
Textfield() → inputBox1Textfield() → inputBox2
AI Drawing Prompt Reference
Draw a graph of a linear function to demonstrate the concepts of slope and intercept. Include input boxes for the slope m and intercept b, and a graph showing y = mx + b. The construction order should be to create the input boxes first, then input the parameters, and finally draw the function graph. Ensure the graph is clear and easy to understand for math learners to grasp the basic properties and practical applications of linear functions.
The prompt above was compiled from the original drawing commands and is for reference only.