
Linear Function Explorer by Audrey McLaren (2)
Loading the math board and drawing, please wait…
In collections
Students' linear functions
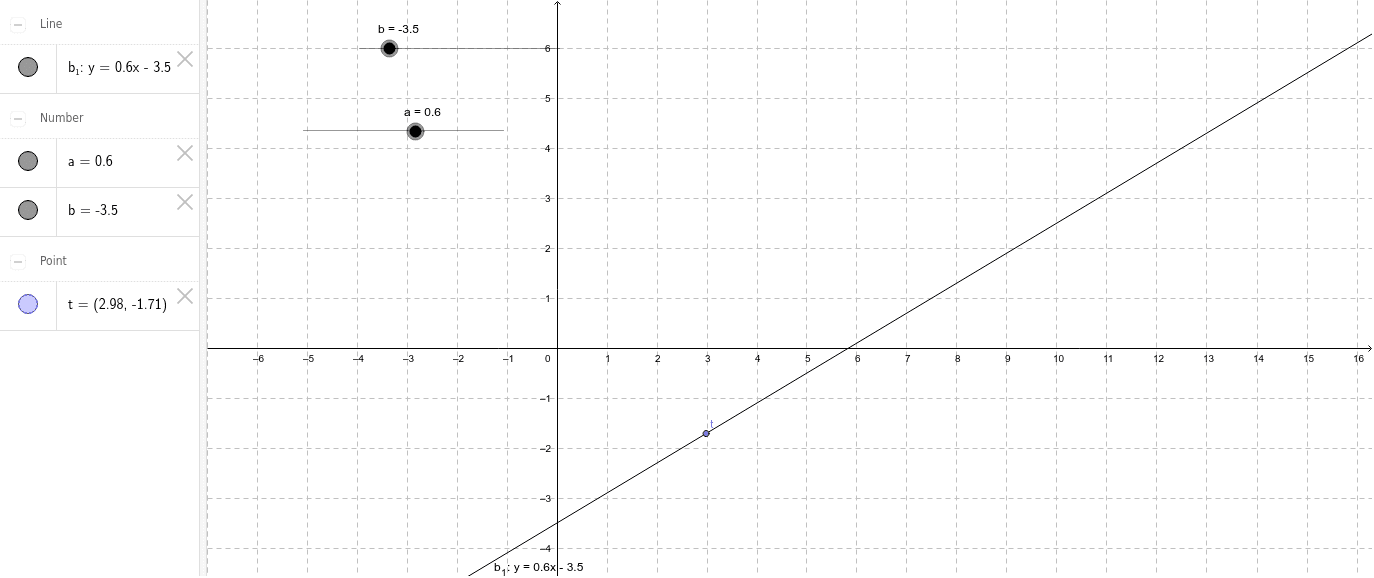
This example demonstrates the dynamic behavior of linear function graphs as parameters change. It involves core math concepts like linear functions, slope, intercept, and geometric transformations. Construction highlights include using GeoGebra commands to create points a, b, b_1, t for key positions and transformations. Suitable for high school mathematics teaching to understand linear function properties and parameter effects.
GeoGebra Commands & Parameters
Point(b_1) → t
AI Drawing Prompt Reference
Draw a dynamic graph showing how linear function images change with parameter variations, including a slider to control parameters, displaying the position and shape of the line as slope and intercept change, with key points marked and geometric transformations shown, observing the effect of parameters on the line through the slider.
The prompt above was compiled from the original drawing commands and is for reference only.