
Linear Equations and Inequalities - Systems
Loading the math board and drawing, please wait…
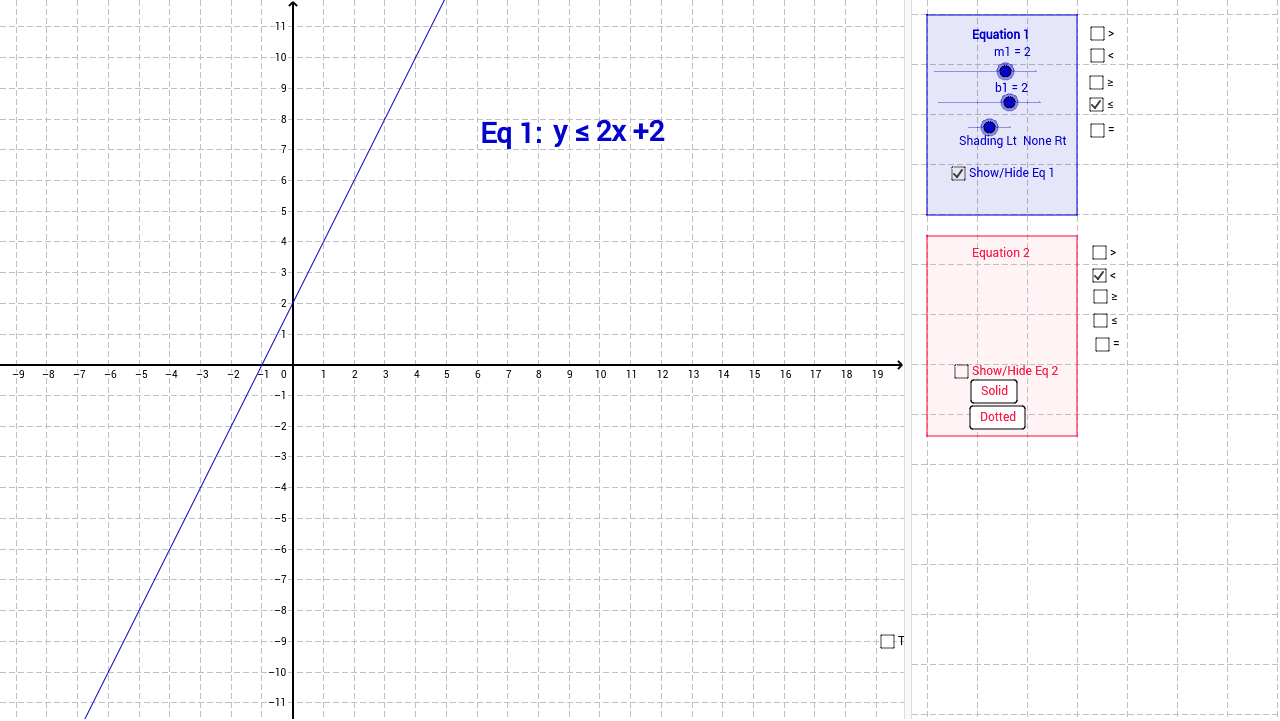
This example demonstrates the graphical representation and interactive manipulation of systems of linear equations and inequalities. It involves core mathematical concepts such as linear equations, inequalities, function graphs, and coordinate geometry. Construction highlights include commands like Circle, Polygon, Text, Semicircle, Line, Point, Slider, and Locus. Suitable for high school mathematics education to help students visually understand the representation and properties of solution sets for linear equations and inequalities.
GeoGebra Commands & Parameters
Circle(A, 30) → cPolygon(B, C, D, E) → poly1, b_1, c_1, d, eText("Equation 1") → text1Semicircle(Point[First[inta]], Point[Last[inta]]) → semia1Semicircle(Point[Last[inta]], Point[First[inta]]) → semia2Polygon(F, G, H, I) → poly2, f_1, g, h, iText("Equation 2") → text2Semicircle(Point[First[intb]], Point[Last[intb]]) → semib1Semicircle(Point[Last[intb]], Point[First[intb]]) → semib2Text("y > " + m1 + "x +" + b1) → text3Text("y < " + m1 + "x +" + b1) → text4Text("y ≥ " + m1 + "x +" + b1) → text5Text("y ≤ " + m1 + "x +" + b1) → text6Text("y > " + m2 + "x +" + b2) → text8Text("Eq 1:") → text7Text("y < " + m2 + "x +" + b2) → text9Text("y ≥ " + m2 + "x +" + b2) → text10Text("y ≤ " + m2 + "x +" + b2) → text11Text("Eq 2:") → text12Line(S2, S1) → sPoint(s) → K1Text("y = " + (y(K1)) + (If[y(K1) < t, "<", If[y(K1) > t, ">", "="]]) + m1 + "*" + (x(K1)) + "+" + b1 + " = " + t) → text21Text("y = " + m1 + "x +" + b1) → text41Text("y = " + m2 + "x +" + b2) → text42
AI Drawing Prompt Reference
Create a diagram for teaching systems of linear equations and inequalities. Start with a large circle as a background reference. Then construct two polygonal regions representing the solution sets of two equations. Inside each polygon, draw semicircular arcs to mark boundary intersections, and add text labels 'Equation 1' and 'Equation 2'. For each equation, generate six text annotations showing inequality forms (>, <, ≥, ≤) of the linear expression. Finally, draw a straight line across the figure, place a point on it, and display a text comparing the point's y-coordinate with the equation's value. The layout should clearly show the graphical relationships between the two linear equations and their inequalities.
The prompt above was compiled from the original drawing commands and is for reference only.