
Linear Equations and Hyperbola Indefinite Integral Visualization
Loading the math board and drawing, please wait…
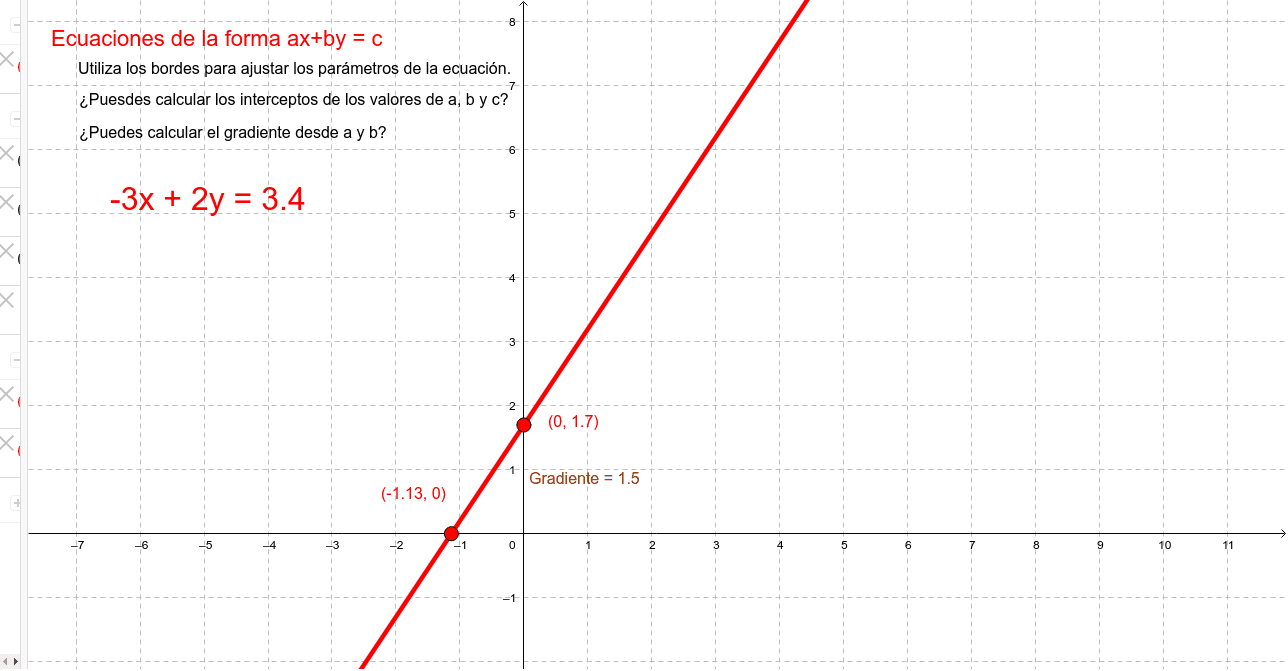
This example demonstrates the graphical relationship between linear equations and hyperbolas (conic sections), while illustrating the geometric meaning of indefinite integrals. Users can adjust parameters a, b, c, d via sliders to modify linear equation coefficients and observe how intersection points with the hyperbola change. Construction uses GeoGebra's Intersect command to find intersection coordinates between lines and hyperbolas, with text objects labeling key points and parameter values. Core concepts include linear equation graphing, conic section (hyperbola) properties, and the geometric interpretation of indefinite integrals. Suitable for high school students learning coordinate geometry and introductory calculus, as well as university-level mathematics students studying visualization of integral concepts.
GeoGebra Commands & Parameters
Intersect(d, yAxis) → AIntersect(xAxis, d) → B
AI Drawing Prompt Reference
Draw two lines intersecting the y-axis and x-axis to get two intersection points, and connect these two points with a line to show the changing intersection points with a hyperbola, while labeling the intersection points and parameter values with text to observe the effect of parameter adjustments on the graph, illustrating the geometric meaning of indefinite integrals.
The prompt above was compiled from the original drawing commands and is for reference only.