
Linear Equation Equal Constant Practice
Loading the math board and drawing, please wait…
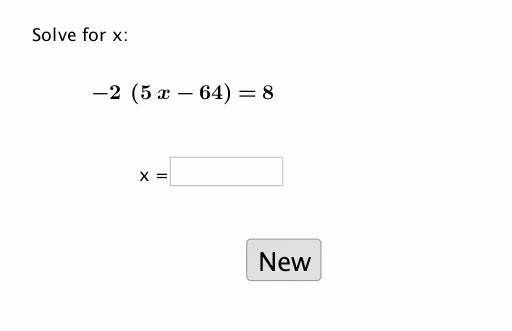
This example demonstrates the graph of a linear equation equal to a constant, involving the core concept of linear functions. Using GeoGebra commands such as Random, RandomElement, and Factor, users can dynamically explore the changes in the graph of a linear equation. Suitable for middle school and above students or teachers for teaching and learning.
GeoGebra Commands & Parameters
Random(-5, 15) → bRandomElement(listm) → mRandom(-5, 15) → aFactor(Simplify[(m * (x - a)) + b]) → fTextfield(empty) → InputBox1
AI Drawing Prompt Reference
Draw a straight line in the form of y = mx + b, where m is randomly selected from a list, and b is a random number between -5 and 15. Then, transform the line equation into (x - a)m + b, where both a and b are random numbers between -5 and 15. Finally, create a blank text box to display or input the line equation.
The prompt above was compiled from the original drawing commands and is for reference only.