
Linear Algebra and Linear Regression
Loading the math board and drawing, please wait…
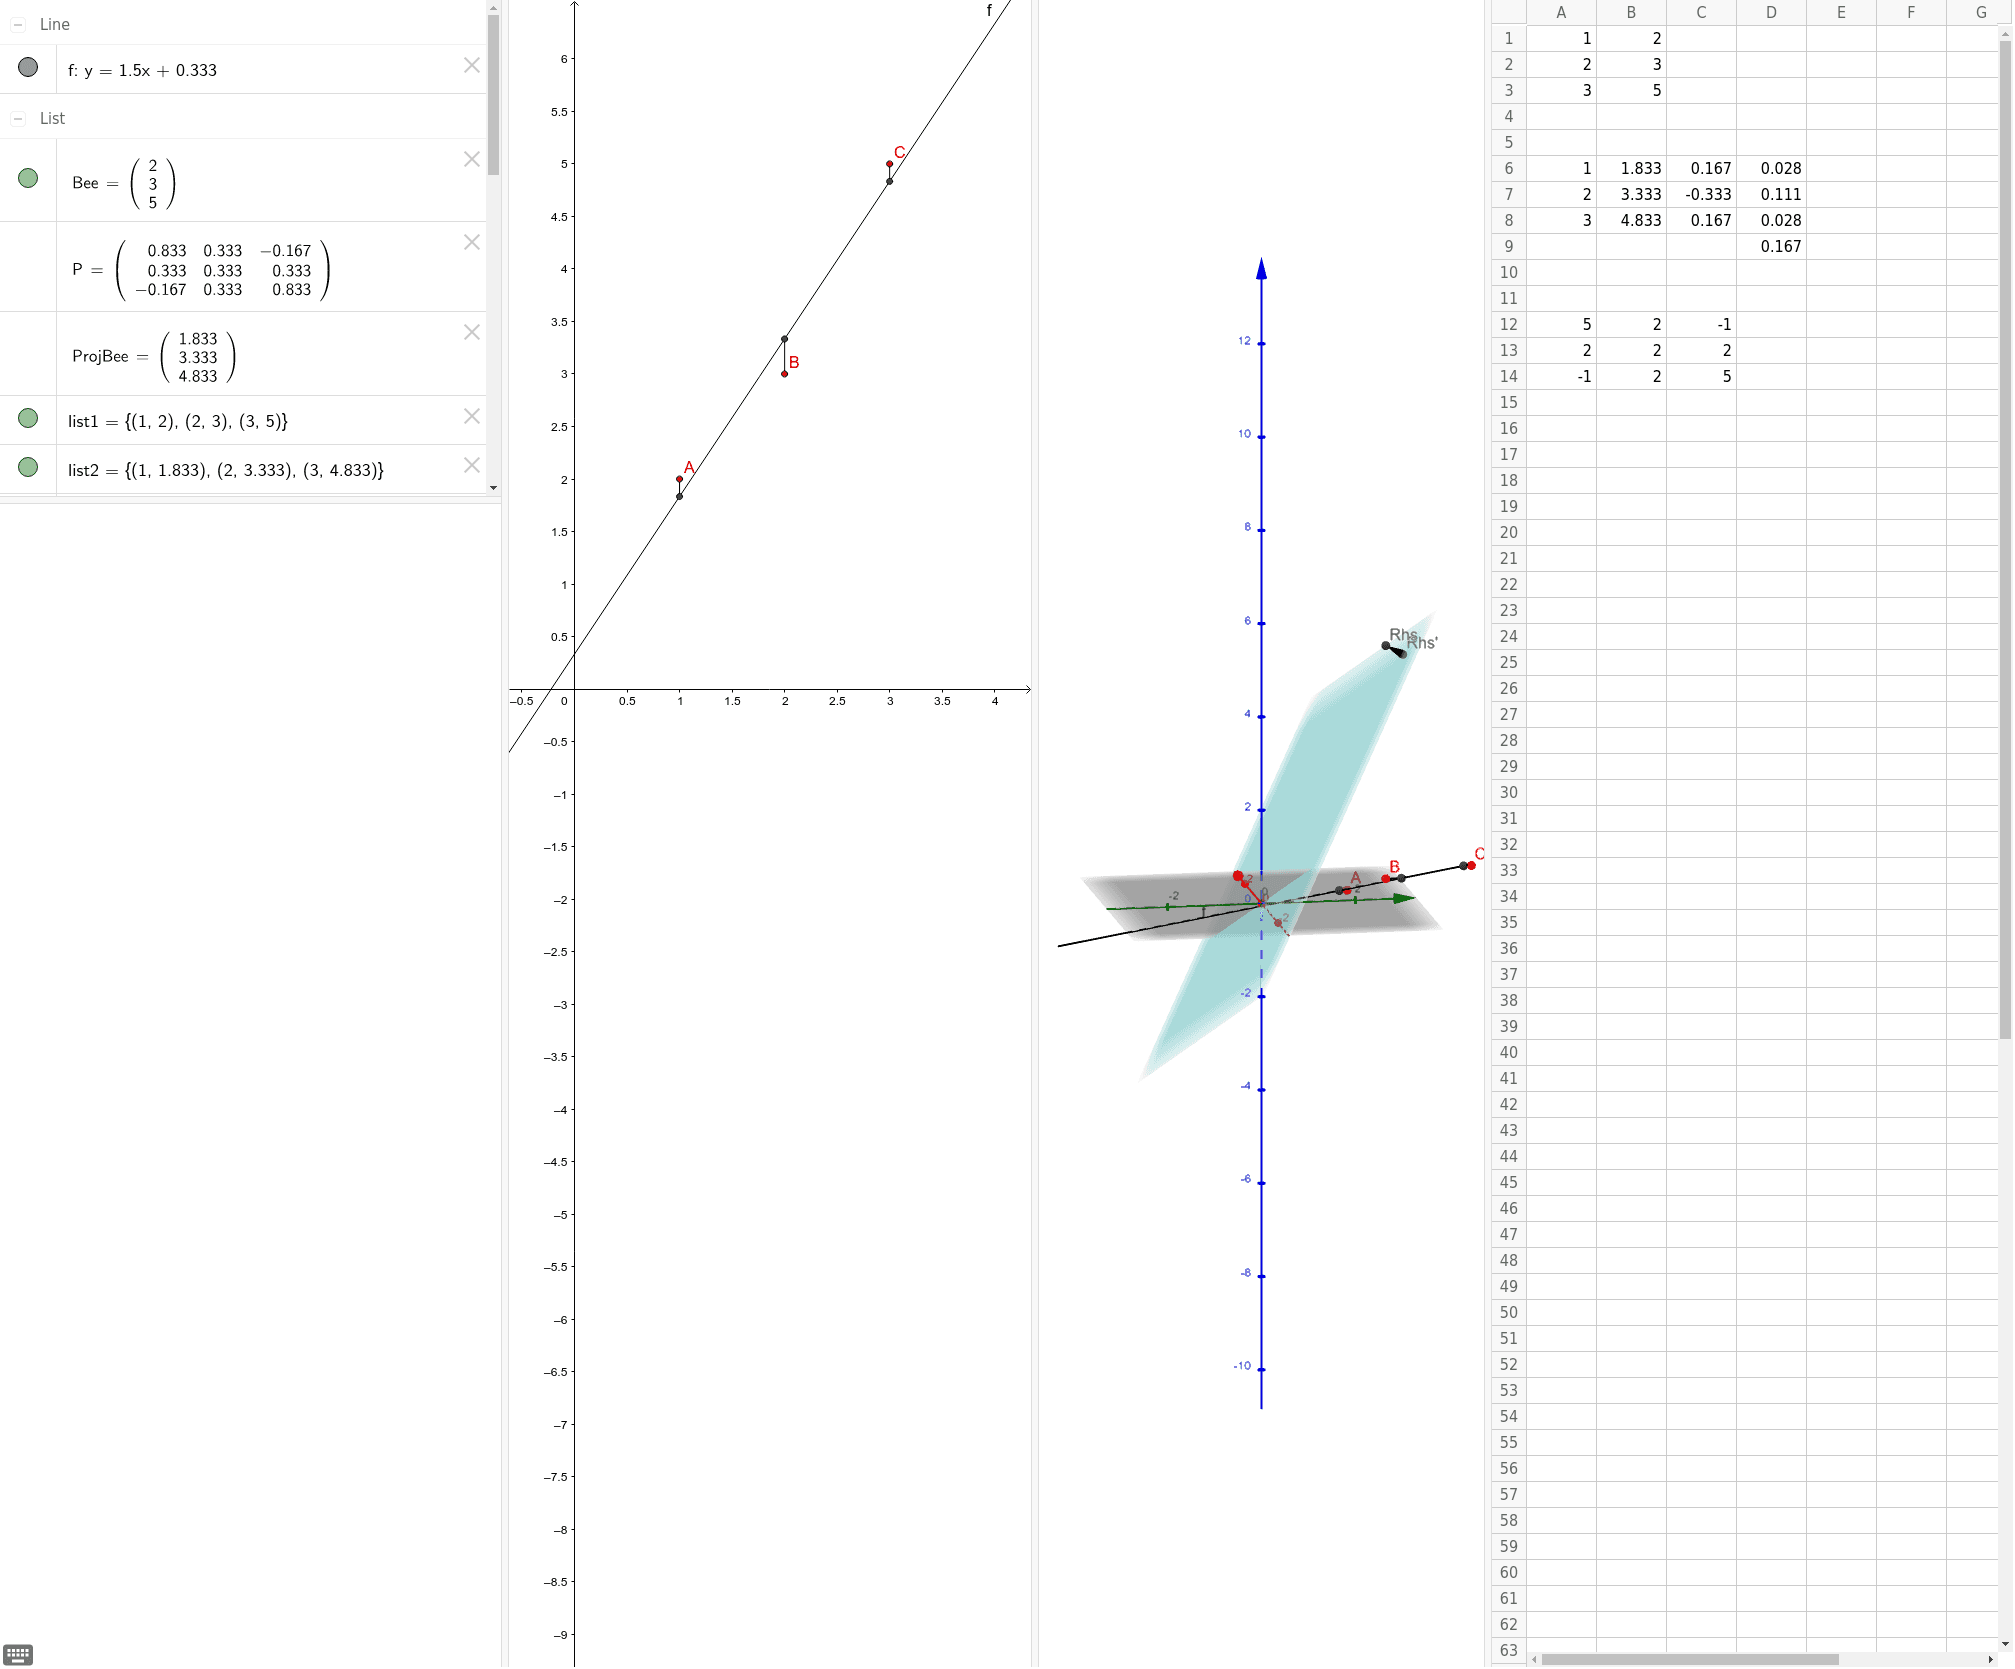
This example demonstrates matrix applications in linear algebra and the fitting process of linear regression, visualizing the central line of data points and geometric shapes. Core math concepts include vectors, matrix operations, linear regression fitting, and geometric constructions. GeoGebra commands like ApplyMatrix, Vector, FitLineY, and Segment are used to construct data points, vectors, fitted lines, and geometric figures. Suitable for high school and above learners to understand the application of linear algebra in data analysis and geometric intuition.
GeoGebra Commands & Parameters
ApplyMatrix(P, Rhs) → Rhs'Vector(Rhs', Rhs) → ErrorFitLineY({A, B, C}) → fSegment(A, D) → gSegment(E, B) → hSegment(C, F) → i
AI Drawing Prompt Reference
Draw a 2D coordinate plane with a set of scattered data points. Fit a straight line through the points that represents the central trend (least-squares regression). From each data point, draw a perpendicular segment to the fitted line to indicate residuals. Additionally, show a vector transformation: an original vector is transformed by a matrix into a new vector, with arrows illustrating both vectors and their relationship. The overall figure should connect linear algebra matrix operations with linear regression fitting, including scatter points, the fitted line, residual segments, and vector arrows.
The prompt above was compiled from the original drawing commands and is for reference only.