
Times Tables Cardioid
Loading the math board and drawing, please wait…
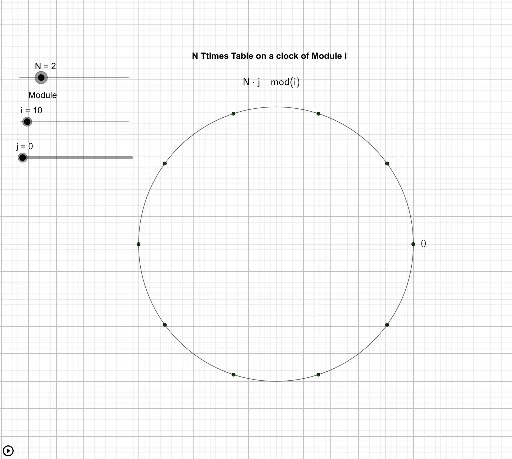
This example demonstrates how to generate a cardioid pattern using GeoGebra by integrating multiplication tables with coordinate geometry. Core math concepts include sequences, matrices, vectors, and piecewise functions. Key GeoGebra commands used are IterationList, Circle, Element, Segment, and Vector. Suitable for high school mathematics education to illustrate the application of sequences and matrices in graphical generation, enhancing geometric intuition and computational skills.
GeoGebra Commands & Parameters
IterationList(f, 0, i) → l1IterationList(g, 0, i) → XCircle((0, 0), 1) → cElement(l3, j) → AElement(l3, j) → BElement(l3, Mod[(N * j), i]) → CSegment(Element[l3, j], Element[l3, Mod[(N * j), i]]) → segmVector(Element[l3, j], Element[l3, Mod[(N * j), i]]) → u
AI Drawing Prompt Reference
Draw a unit circle centered at the origin. Place equally spaced points on the circumference, with the number of points determined by the multiplication table multiplier. From each point, draw a line segment to another point on the circle, whose index is the product of the current index and the multiplier, taken modulo the total number of points. These segments form a cardioid-like envelope inside the circle. All segments are chords, each directed from its start to end point. The resulting pattern is symmetric and rhythmic, composed of many intersecting chords.
The prompt above was compiled from the original drawing commands and is for reference only.