
Limits, Rates of Change, and Tangent Lines by JerryL
Loading the math board and drawing, please wait…
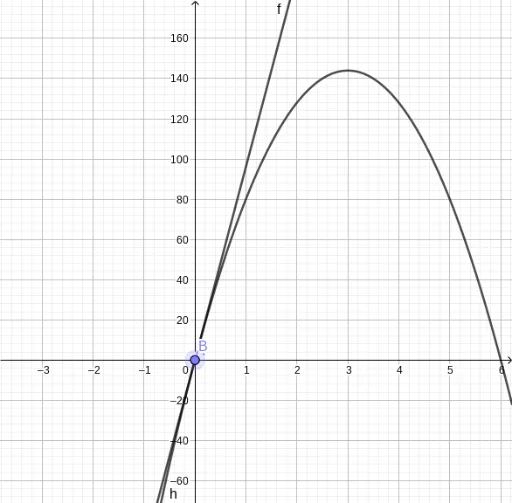
This example illustrates the concepts of limits, rates of change, and tangent lines. By analyzing function graphs, students can intuitively understand the definition of limits and how to use derivatives to calculate rates of change and tangent slopes. The construction summary uses GeoGebra commands like Point and Line to help users easily draw function graphs and tangents.
GeoGebra Commands & Parameters
Point(h) → APoint(h) → BLine(A, B) → f
AI Drawing Prompt Reference
Draw a function graph, then select two points A and B on the curve and connect them with a line to illustrate the concept of a tangent line.
The prompt above was compiled from the original drawing commands and is for reference only.