
Limits of Functions
Loading the math board and drawing, please wait…
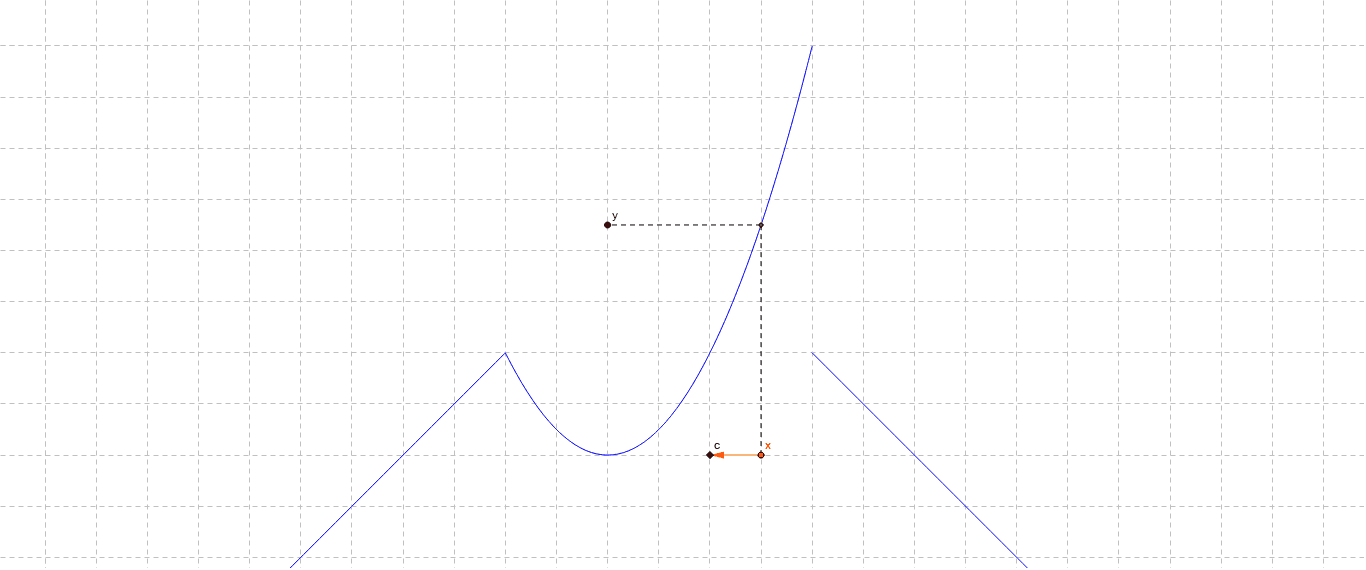
This example illustrates the concept of function limits. By observing the changes in the function graph, it helps understand the definition of limits and their behavior at different points. It uses GeoGebra commands such as point, segment, and vector for construction. Suitable for high school mathematics education and learning.
GeoGebra Commands & Parameters
Point(xAxis) → DSegment(D, E) → aSegment(E, F) → bPoint(xAxis) → AVector(D, A) → u