
Limits Explorer: Interactive GeoGebra Demo for Visualizing Function Limits
Loading the math board and drawing, please wait…
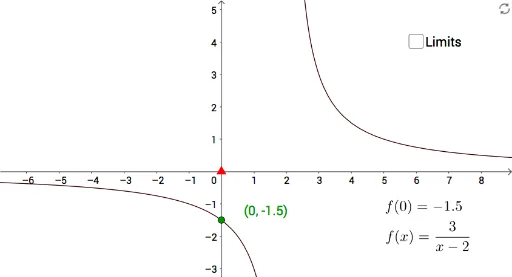
①This GeoGebra example, titled 'Limits Explorer', provides an interactive tool to dynamically demonstrate the limit behavior of a function as the independent variable approaches a target value or infinity, making the concept of convergence visually tangible. ②The core mathematical concept is the limit in calculus, including one-sided limits, the existence of limits, and the behavior near a point; it also incorporates auxiliary objects such as a rhombus, cylinder, geometric mean, and statistical characteristics, potentially linking limit ideas to geometric or statistical interpretations. ③Construction highlights: based on the summary, the example uses GeoGebra commands like Point, Intersect, Defined, and If, with objects f (function), A, C (points), Limits, g, h, d (auxiliary lines/functions), B, D (points), e, text1, text2, a (parameter), Text2, and text3 (text labels). A slider or input controls parameter 'a' to update the limit value and display explanatory text dynamically. ④This resource is suitable for high school to early college calculus instruction, useful for classroom demonstrations of limit concepts, student self-exploration of function approximation, and as a template for teachers creating limit-related lessons.
GeoGebra Commands & Parameters
Point(xAxis) → AIntersect(f, g, (-0.5, -1.2)) → BIntersect(f, h, (0.5, -2)) → DDefined(C) → eDefined(C) → aIf(e, "", "Undefined \;Point") → Text2