
Quadratic Function Practice
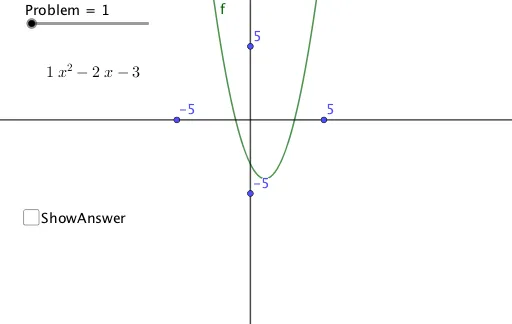
Loading the math board and drawing, please wait…
This example demonstrates the basic properties and graphs of quadratic functions. It involves core mathematical concepts such as quadratic equations and parabolas. Using GeoGebra commands like Element and Random, it dynamically generates and analyzes quadratic functions. Suitable for middle school and above students for learning and practicing quadratic functions.
GeoGebra Commands & Parameters
Element(C1:C10, Problem) → cRandom(1, 5) → A1Random(1, 5) → A2Random(1, 5) → A3Random(1, 5) → A4Random(1, 5) → A5Random(1, 5) → A6Random(1, 5) → A7Random(1, 5) → A8Random(1, 5) → A9Random(1, 5) → A10Random(-5, D1) → C1Random(-5, D2) → C2Random(-5, D3) → C3Random(-5, D4) → C4Random(-5, D5) → C5Random(-5, D6) → C6Random(-5, D7) → C7Random(-5, D8) → C8Random(-5, D9) → C9Random(-5, D10) → C10Min(f, -1000, 1000) → AElement(A1:A10, Problem) → aElement(B1:B10, Problem) → bFactors(b^(2) - ((4 * a) * c)) → M_1DivisorsList(b^(2) - ((4 * a) * c)) → L_1Factors(b^(2) - ((4 * a) * c)) →Sequence(Element[M_1, p, 1]^(Element[L_2, p]), p, 1, Length[L_2]) → L_3Sequence(p^(2), p, 1, 30) → squaresMax(Intersection[L_1, squares]) → j
AI Drawing Prompt Reference
Draw a quadratic function graph where the coefficient of the quadratic term is a random number between 1 and 5, the coefficient of the linear term is a random number between -5 and the quadratic term coefficient, and the constant term is a random number between -5 and 5. Calculate the vertex coordinates based on these coefficients and draw the quadratic function graph.
The prompt above was compiled from the original drawing commands and is for reference only.