
Limits Example 4: Two Sides to a Limit
Loading the math board and drawing, please wait…
In collections
BC Calculus
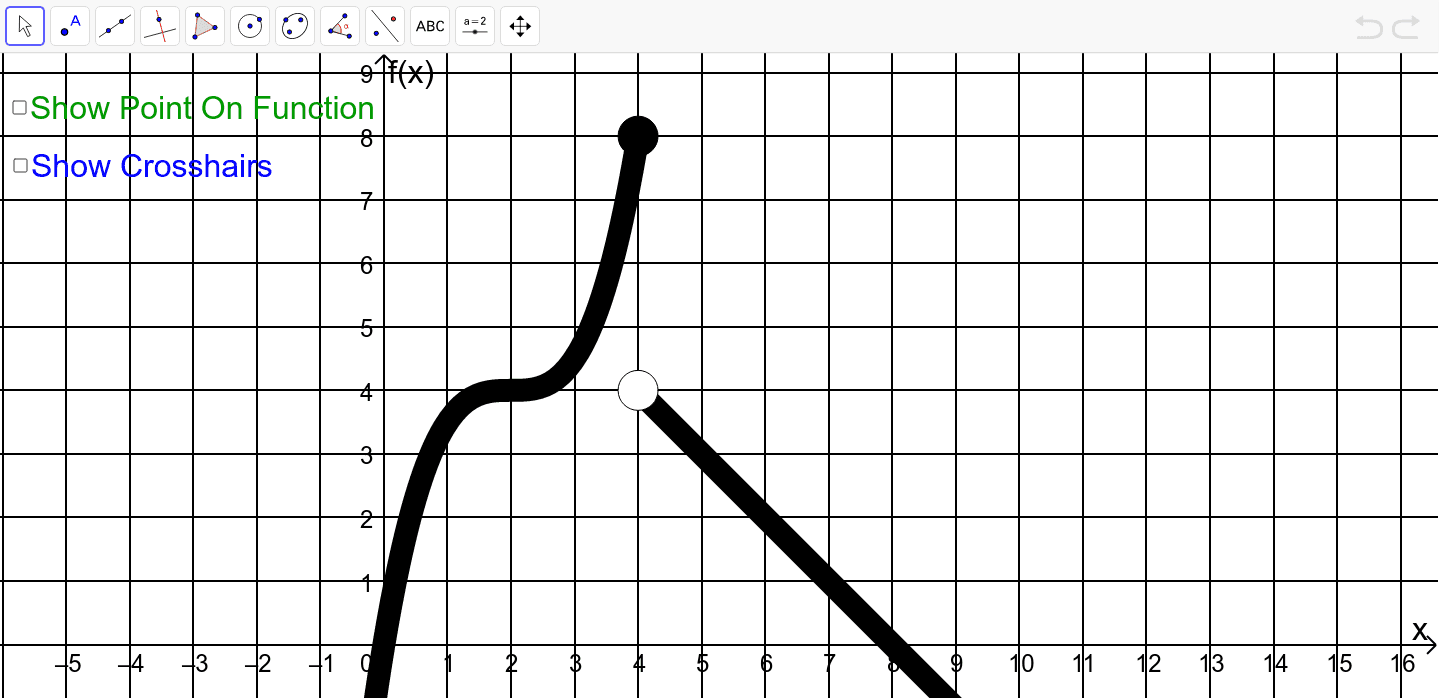
This example demonstrates the graphical phenomenon that a function's limit must be approached from both sides to exist. It involves core math concepts like function limits, step functions, pie charts, and histograms. Constructed using GeoGebra commands/objects such as Point, Segment, a, b, f, C, D, c, E, d, text1, text2, t, F, e, F_1. Suitable for high school and above students studying calculus and probability & statistics.
GeoGebra Commands & Parameters
Point(f) → CSegment(C, D) → cSegment(E, C) → d
AI Drawing Prompt Reference
Draw a graphical example of a function limit, showing that the limit must be approached from both sides to exist. Include a function graph, a horizontal segment starting from a point on the graph, and a line segment extending from that point to the left, forming a closed area to illustrate the concept of a limit.
The prompt above was compiled from the original drawing commands and is for reference only.